
OTE Pattern Recognition Notes
Version 8.1 by Drunk Monkey on 2020-06-28 19:35
Quick Links
Optimal Trade Entry Primer
- one of many trading patterns, one of the easiest
- trading plan needs to be simple:
- what's your risk model
- how to frame that?
- what makes your entry
- what gives you indicators of bullish/bearish market?
- how do you execute the trade?
- how do you manage the trade?
- where do you take profits?
- what make the market predisposed to go higher or lower?
- look at HTF (M, W, D, 4h) and look for key levels where price has moved away from in the past
- HTF shows where the big players are most likely going to push things around.
- LTF is too noisy to show this detail.
- Assuming bullish market, we are looking for where the market wants to trade higher. OTE is based on buying during the retracements that occur before the further push upwards.
- The impulse move has to incorporate a break in Market Structure.
- Using Fib Retracement as a visual guide, set the following levels
- -1 - Symmetrical Price Swing
- -0.62 - TP2
- -0.27 - TP1
- 0 - First Profit - Scaling
- 0.5 - Equilibrium
- 0.618 - 62% retracement
- 0.705 - OTE 70.5%
- 0.79 - 79%
- 1 - 100%, or likely SL
- OTE (70.5%) is an ideal target. getting deeper is better, but you run the risk of not filling your order. 62% retracement is also acceptable, but it results in smaller profits because our SL range will be larger, necessitating smaller order sizes to maintain our risk profile.
- First Scaling, or slightly before, represents the place to take initial profits. It should be a decent return, preferable better than 1:2 risk/reward, but slightly less than 2 (1.5? 1x75?) is also acceptable.
- Setups on 1h charts better than 5m charts because the pip movements will be larger.
- Key levels xxx.00, xxx.20, xxx.50, xxx.80, yyy.00
- Place the fibs on the body of the candles
- Market structure - example given:
- monthly view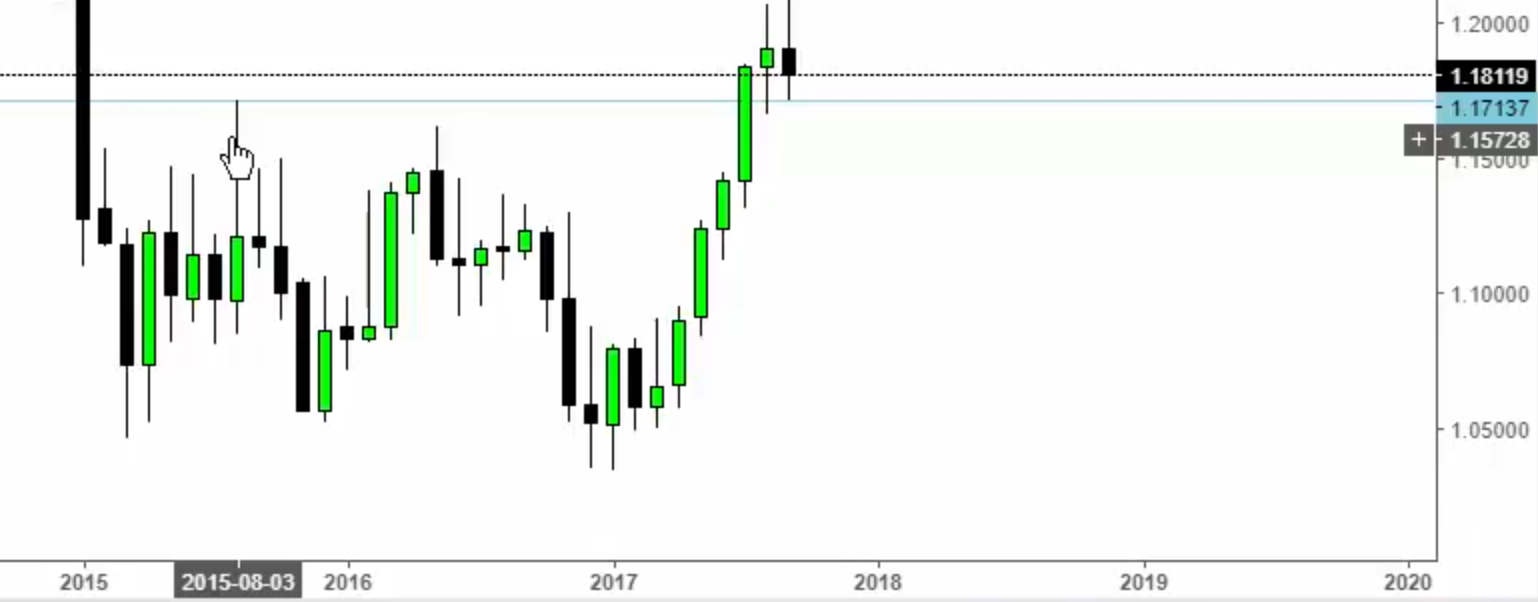
- daily view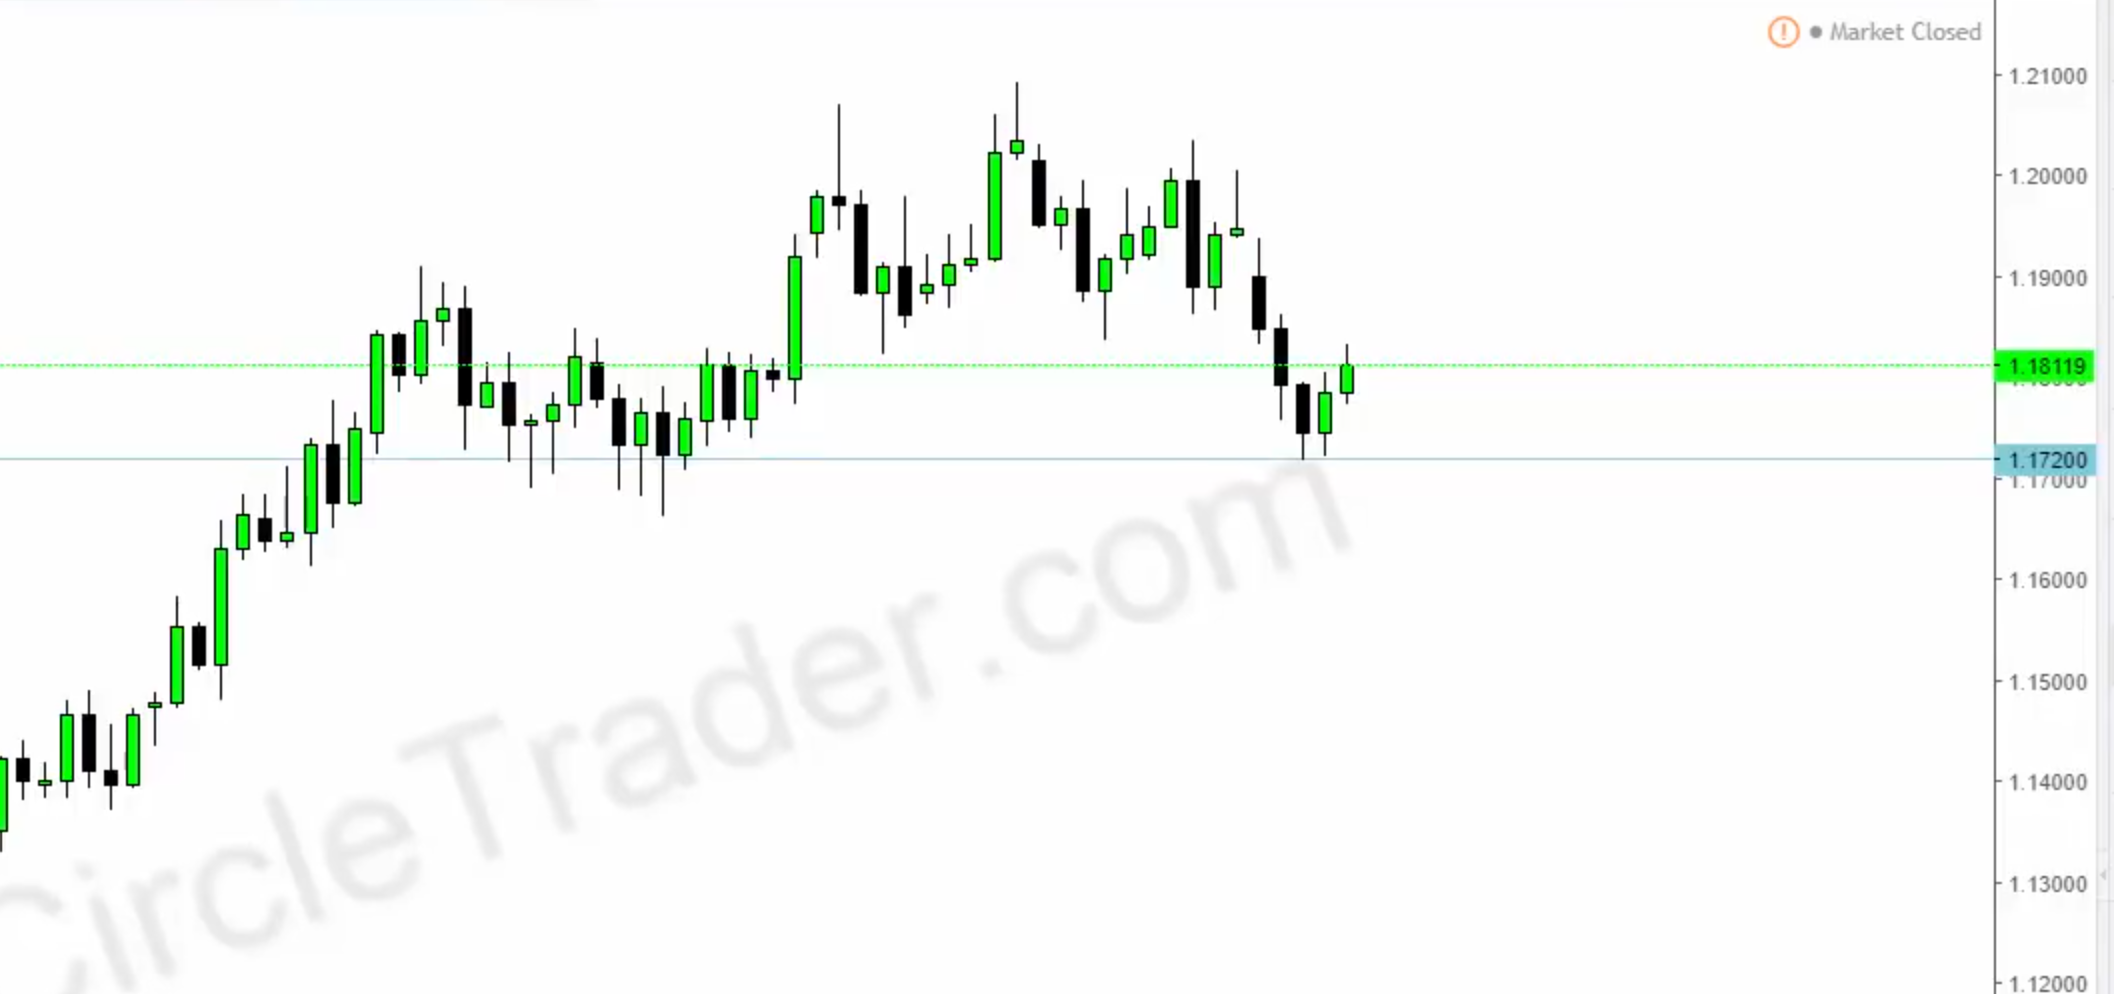
- 15m view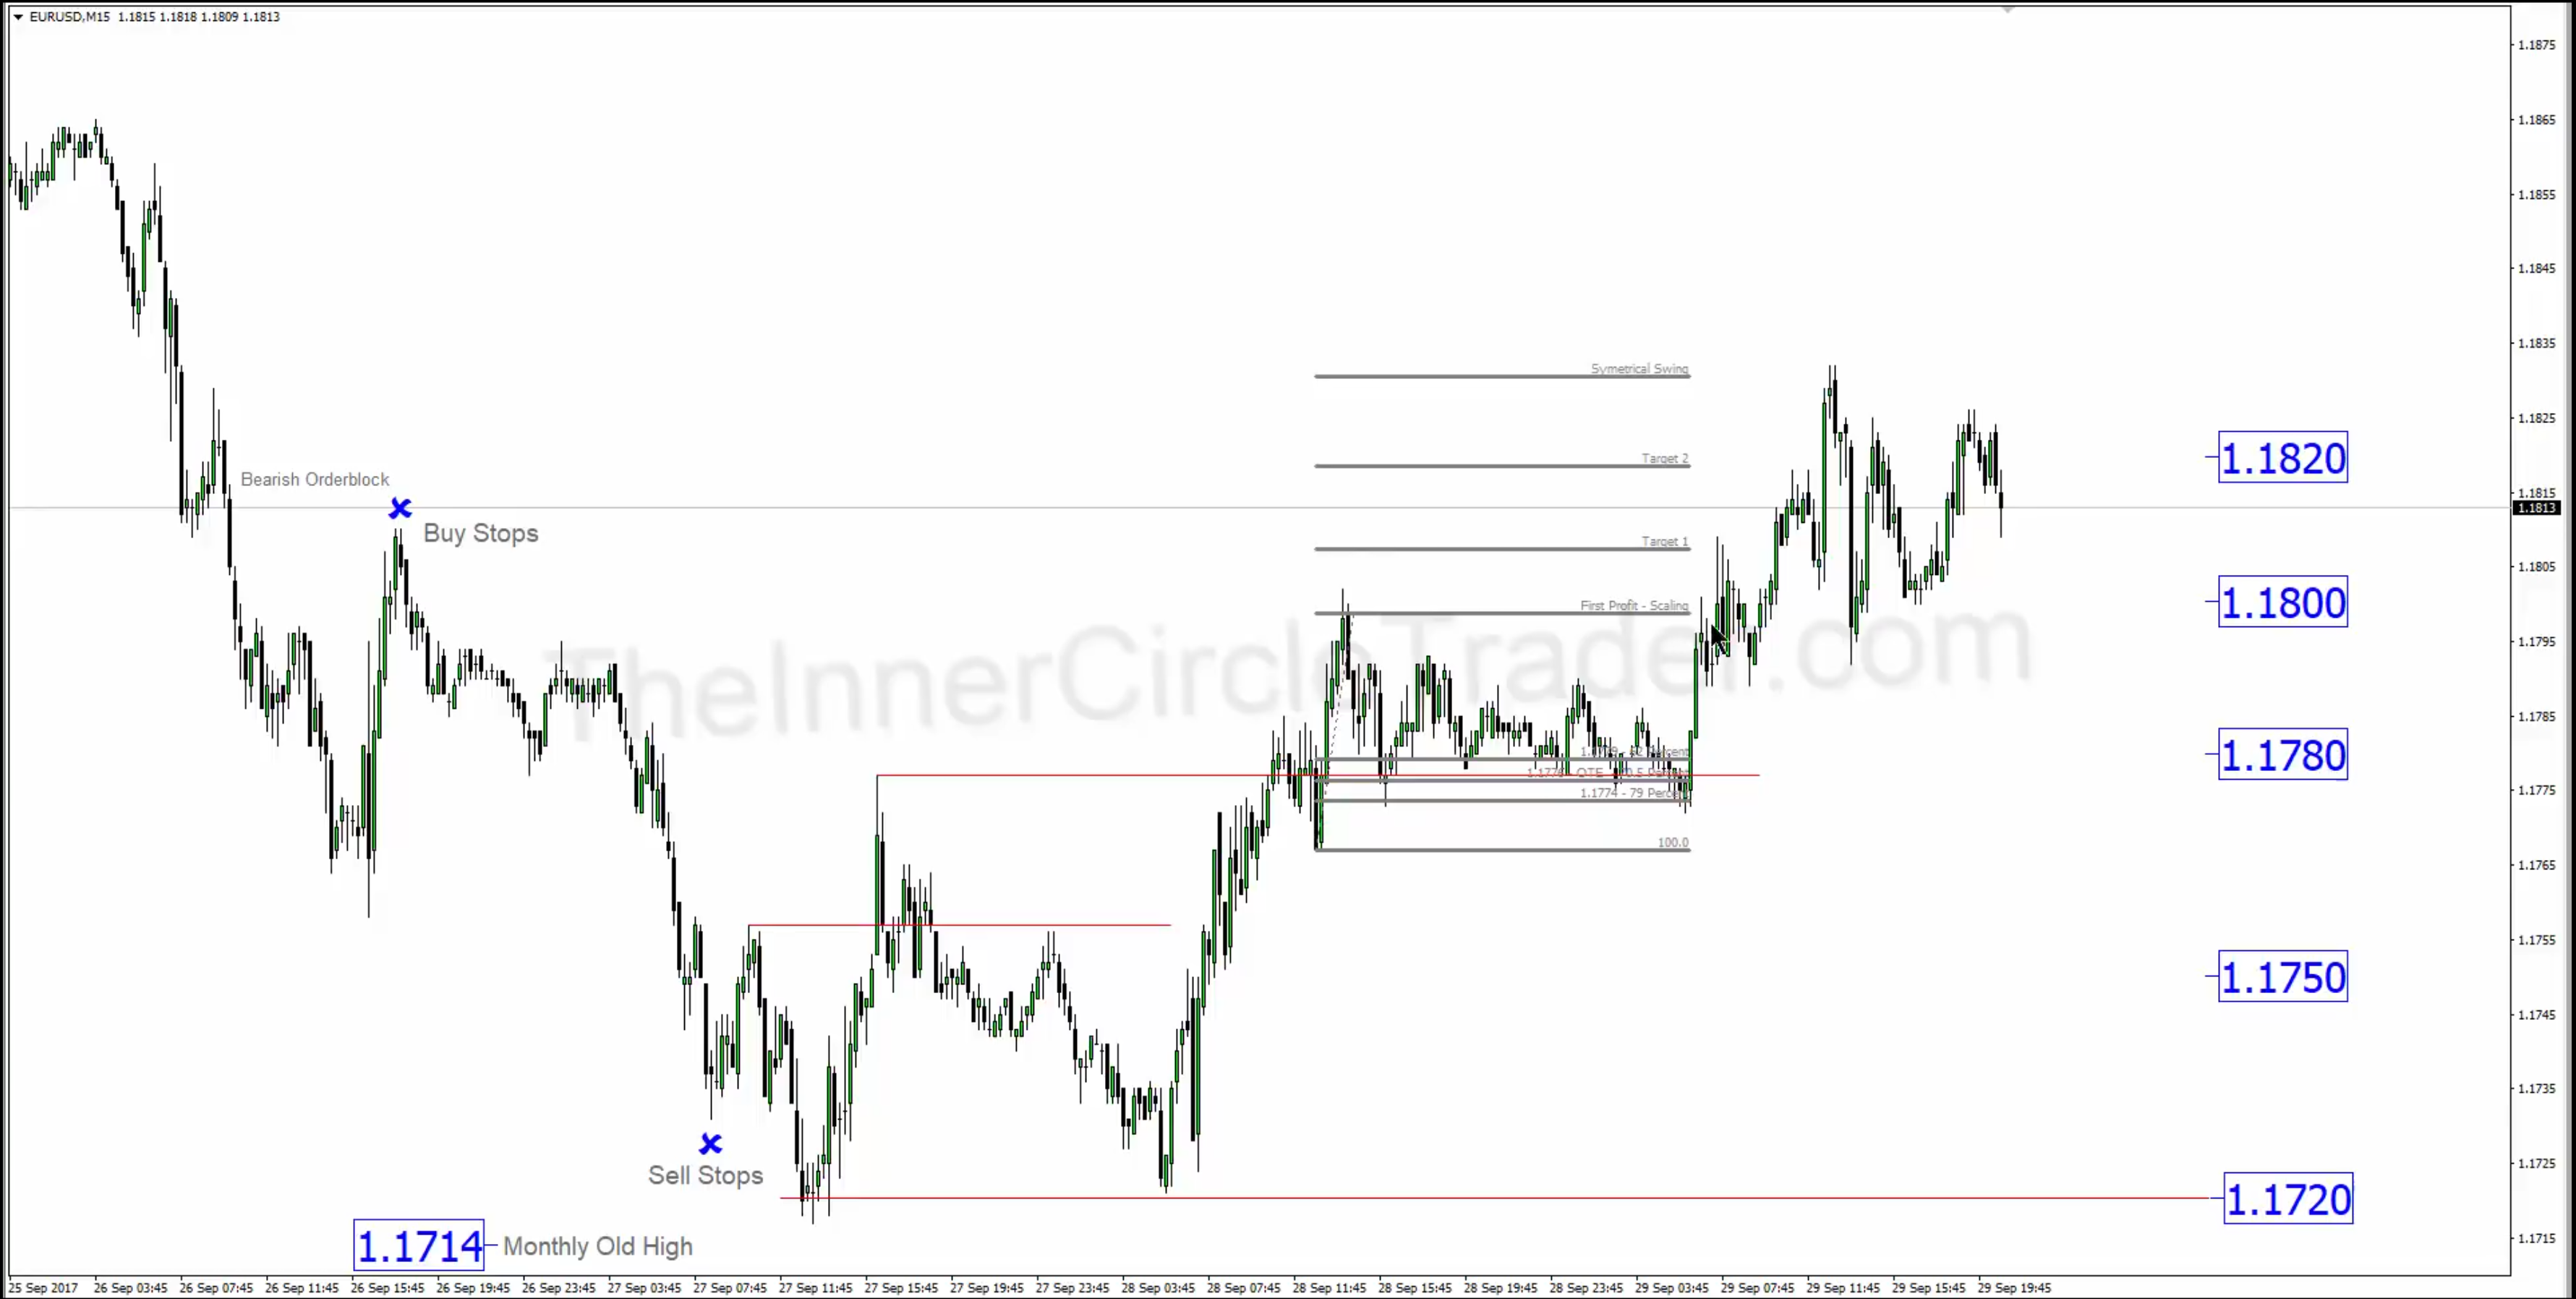
- Note the following:
- institutional levels
- old monthly high at 1.1720 (1.17137 rounded)
- price runs down until it hits the 20 level (1.1720), rallies and creates a new short term high (old - middle red line, new STH, top red line. It's also called a "market structure break"
- the new STH makes for a more likely trade opportunity. (market maker model) and opens up the chance for an OTE.
- also, a high, with two lower highs on either side makes that high more significant. when this high is broken, it's a more convincing move than breaking the other shorter term highs, thus giving us the opportunity to find a likely OTE.
- at the fib, we see price rockets away from a STL
- when old highs/lows are broken, trades will tend to reach back to those old positions (retail calls it "support")
Introduction
sdfg
Example 1
Example 2
Example 3
Example 4
Example 5
Example 6
Example 7
Example 8
Example 9
Example 10
Example 11
Example 12
Example 13
Example 14
Example 15
Example 16
Example 17
Example 18
Example 19
Example 20