
OTE Pattern Recognition Notes
Last modified by Drunk Monkey on 2023-01-14 05:38
Quick Links
Optimal Trade Entry Primer
- one of many trading patterns, one of the easiest
- trading plan needs to be simple:
- what's your risk model
- how to frame that?
- what makes your entry
- what gives you indicators of bullish/bearish market?
- how do you execute the trade?
- how do you manage the trade?
- where do you take profits?
- what make the market predisposed to go higher or lower?
- look at HTF (M, W, D, 4h) and look for key levels where price has moved away from in the past
- HTF shows where the big players are most likely going to push things around.
- LTF is too noisy to show this detail.
- Assuming bullish market, we are looking for where the market wants to trade higher. OTE is based on buying during the retracements that occur before the further push upwards.
- The impulse move has to incorporate a break in Market Structure.
- Using Fib Retracement as a visual guide, set the following levels
- -1 - Symmetrical Price Swing
- -0.62 - TP2
- -0.27 - TP1
- 0 - First Profit - Scaling
- 0.5 - Equilibrium
- 0.618 - 62% retracement
- 0.705 - OTE 70.5%
- 0.79 - 79%
- 1 - 100%, or likely SL
- OTE (70.5%) is an ideal target. getting deeper is better, but you run the risk of not filling your order. 62% retracement is also acceptable, but it results in smaller profits because our SL range will be larger, necessitating smaller order sizes to maintain our risk profile.
- First Scaling, or slightly before, represents the place to take initial profits. It should be a decent return, preferable better than 1:2 risk/reward, but slightly less than 2 (1.5? 1x75?) is also acceptable.
- Setups on 1h charts better than 5m charts because the pip movements will be larger.
- Key levels xxx.00, xxx.20, xxx.50, xxx.80, yyy.00
- Place the fibs on the body of the candles
- Market structure - example given:
- monthly view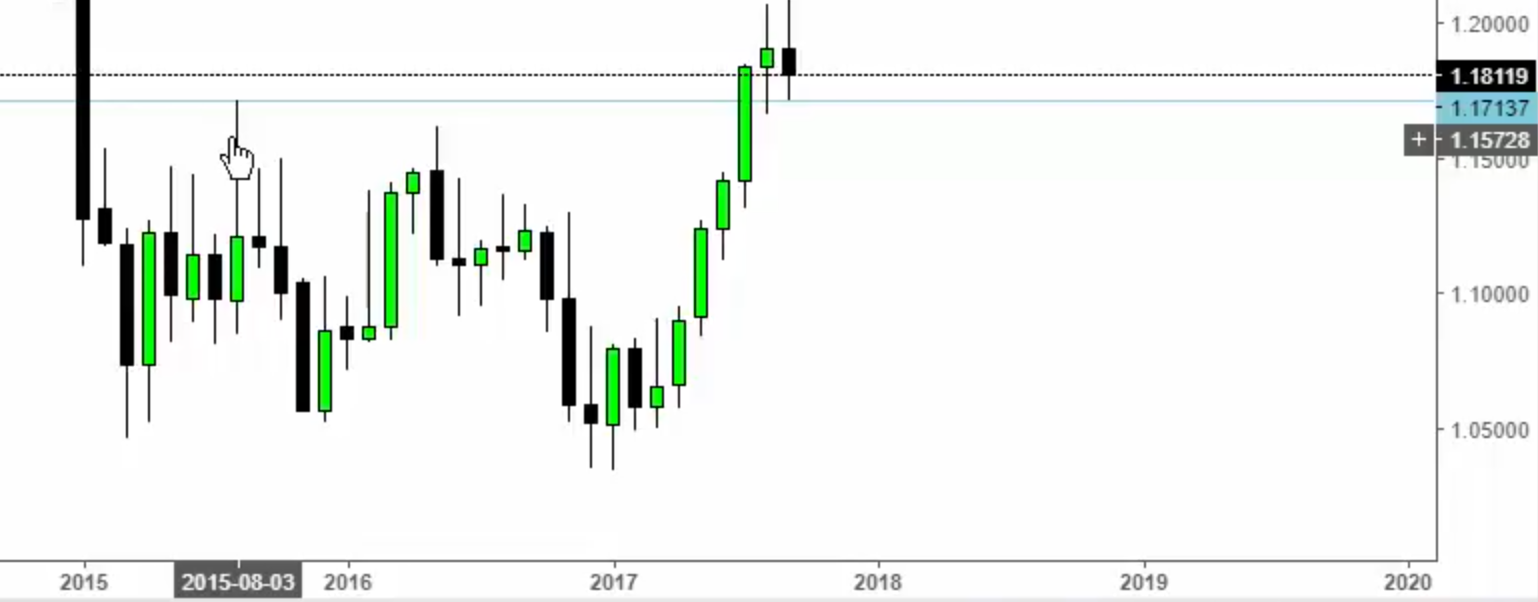
- daily view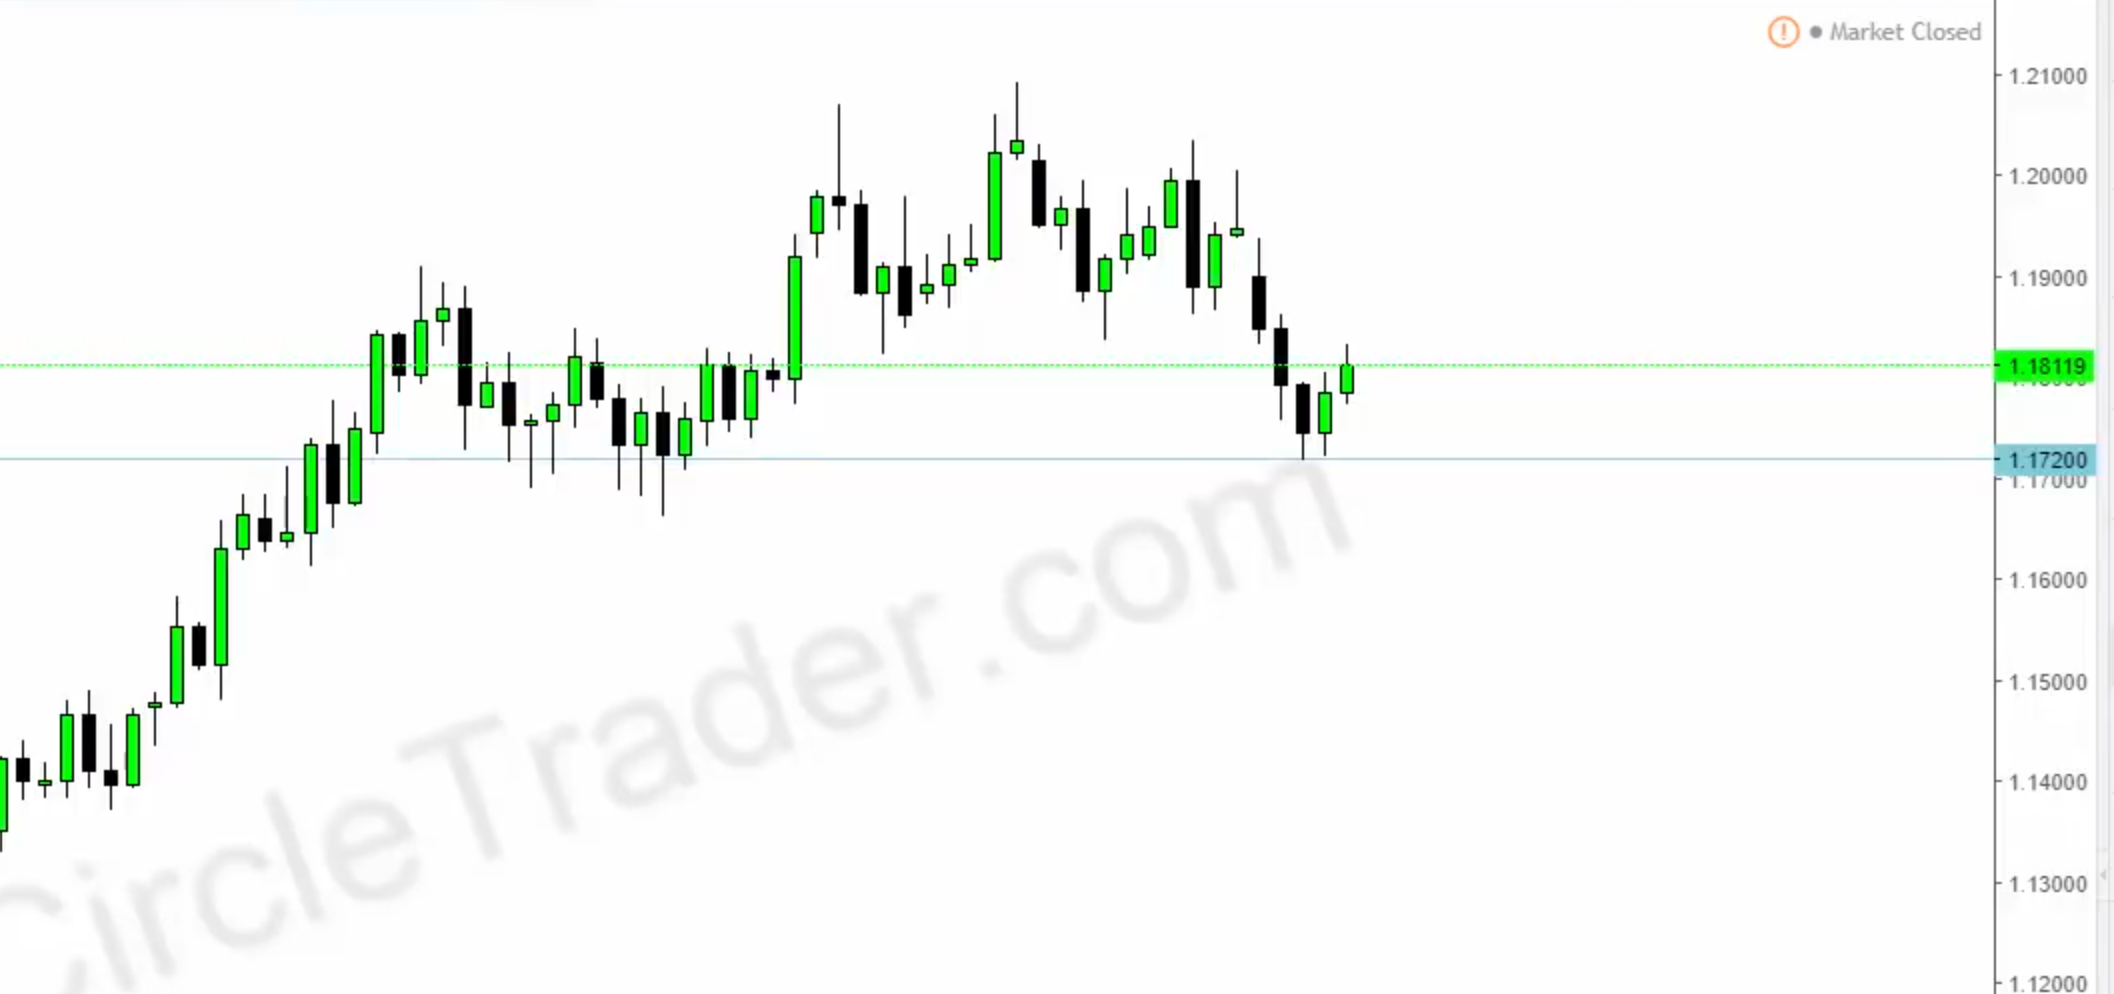
- 15m view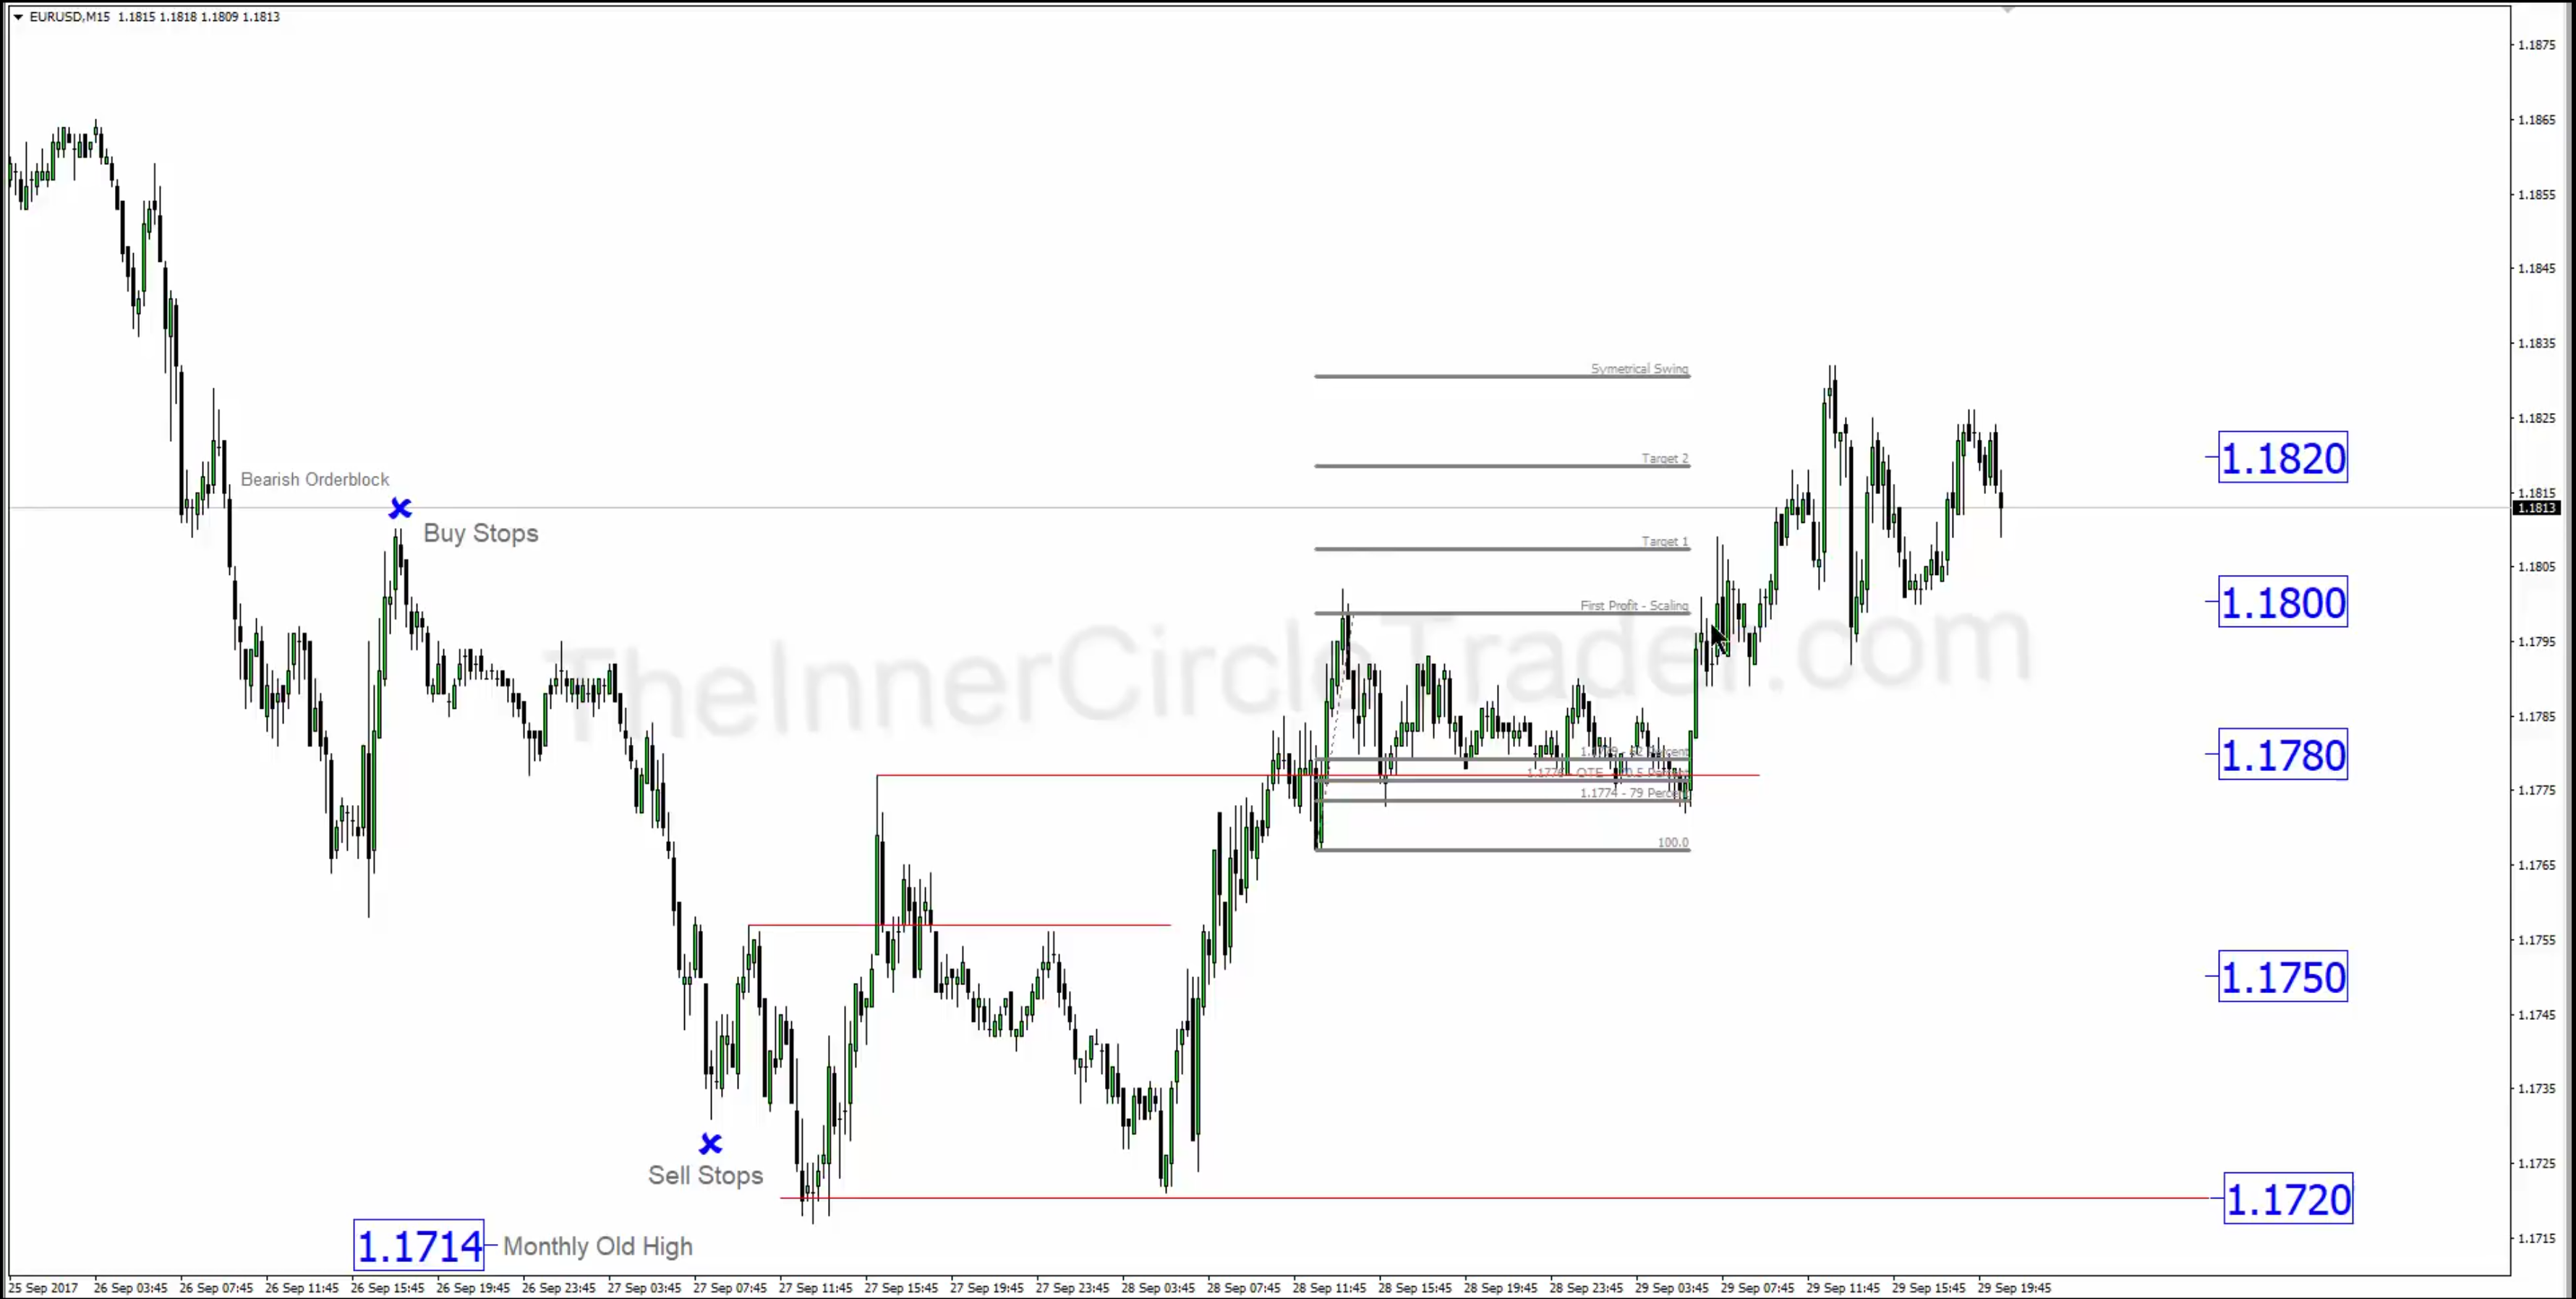
- Note the following:
- institutional levels
- old monthly high at 1.1720 (1.17137 rounded)
- price runs down until it hits the 20 level (1.1720), rallies and creates a new short term high (old - middle red line, new STH, top red line. It's also called a "market structure break"
- the new STH makes for a more likely trade opportunity. (market maker model) and opens up the chance for an OTE.
- also, a high, with two lower highs on either side makes that high more significant. when this high is broken, it's a more convincing move than breaking the other shorter term highs, thus giving us the opportunity to find a likely OTE.
- at the fib, we see price rockets away from a STL
- when old highs/lows are broken, trades will tend to reach back to those old positions (retail calls it "support")
[top]
Introduction - AUDUSD
- how to annotate the charts to look for specific price patterns
- study for the patterns for a month, and it'll start to become more easily recognizable as you train your brain to recognize it, then see if you can see it live
- the pattern should appear every day, but not necessarily on the same pairs
- daily chart - audusd, 20-apr-2020 contains two down candles, showing orderblock
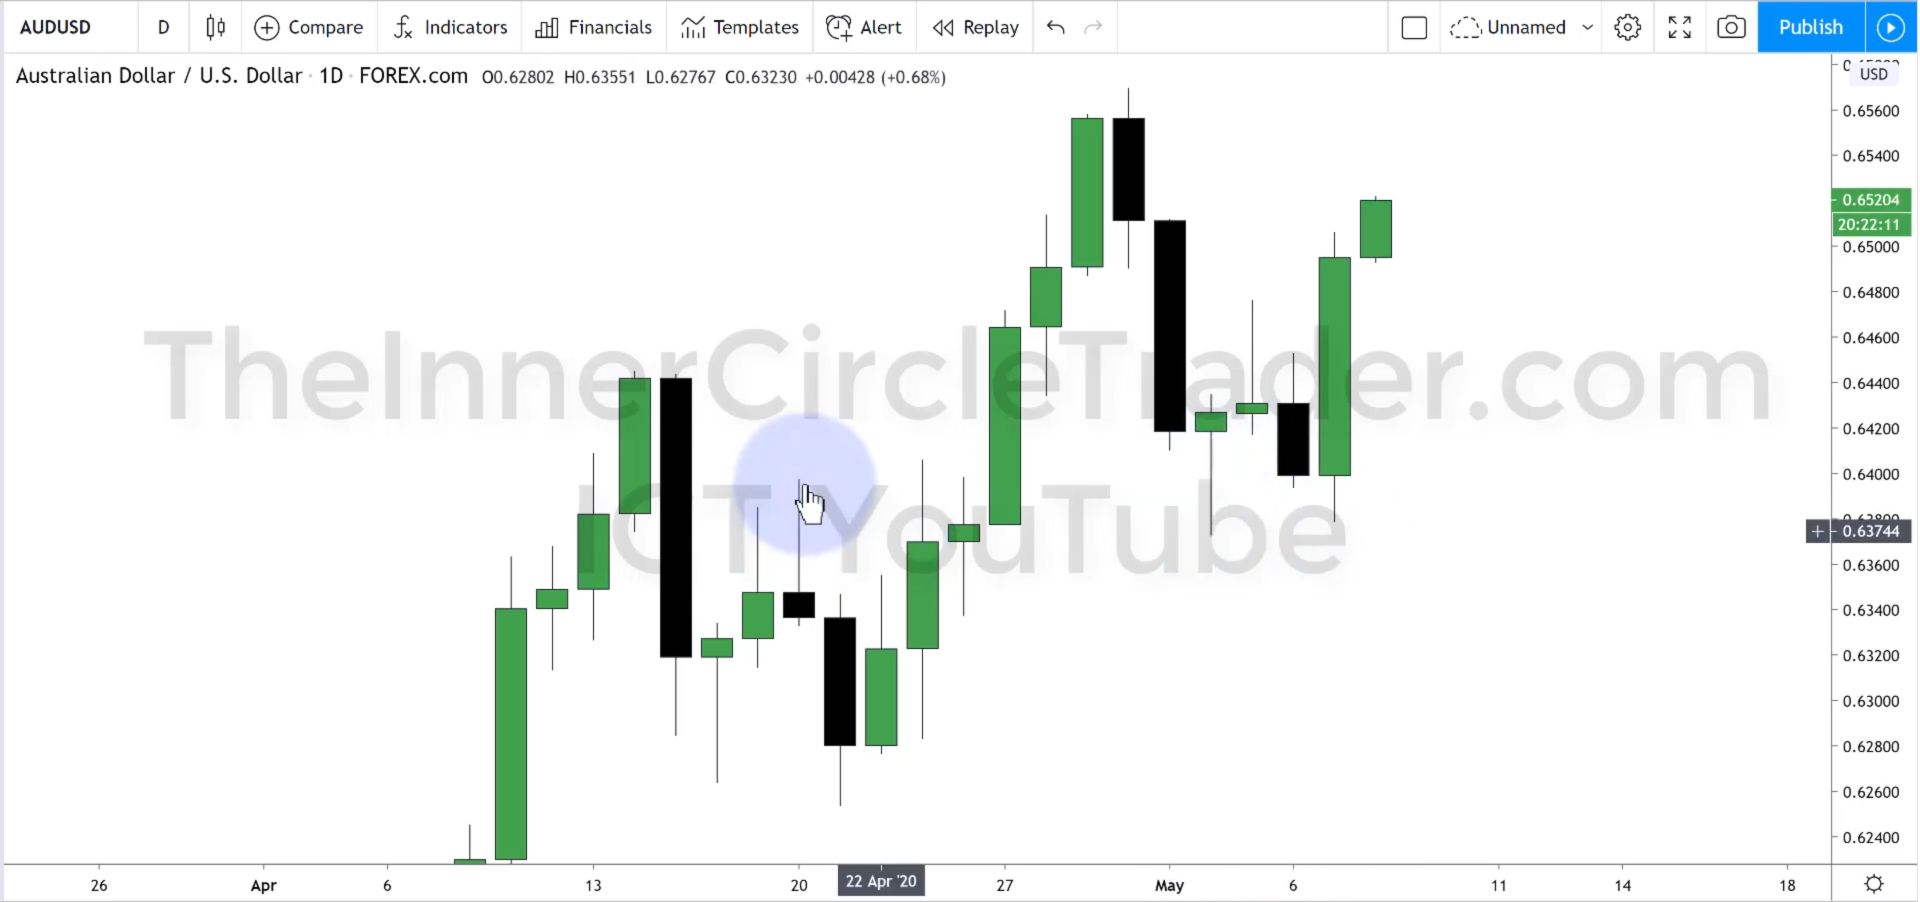
- the two equal lows in May are sensitive to prices in that order block
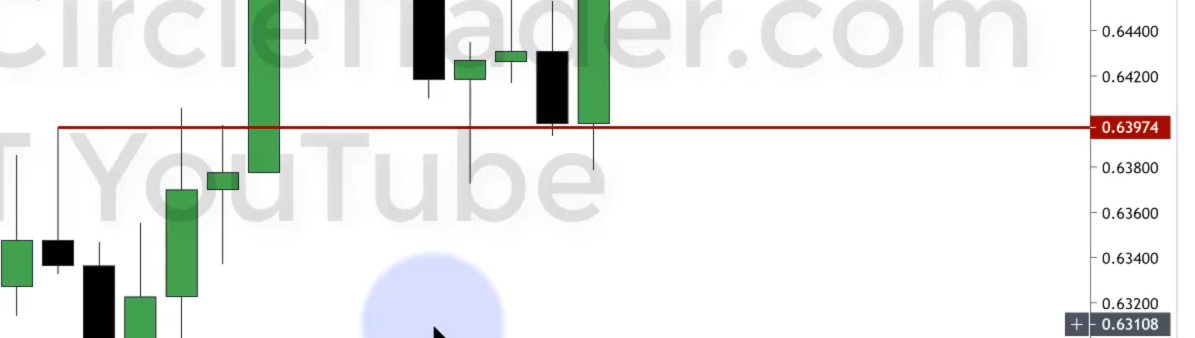
- we are primarily looking for reactions to the previous days range. (last visible green candle in the picture above)
- can we determine whether the price is going to be able to break the previous days high or low?
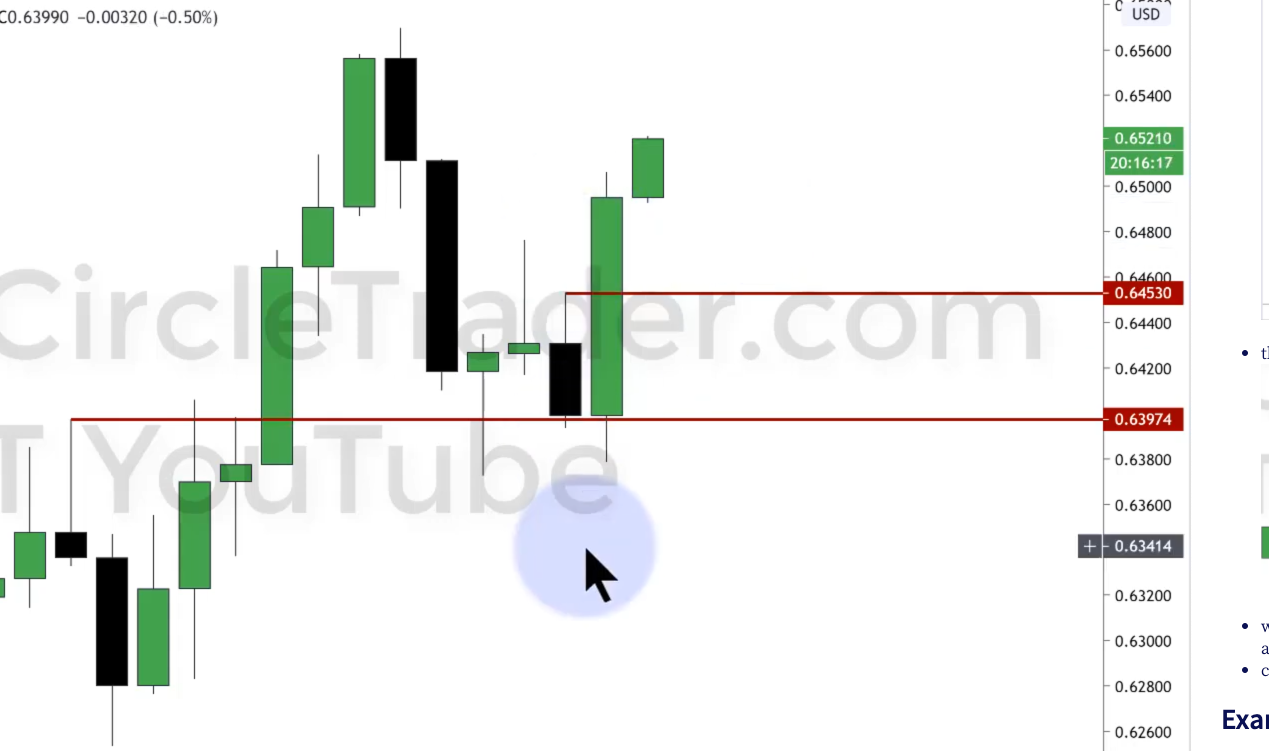
We can see that the recent lows pushed slightly into the order block, but returned indicating that prices doesn't currently want to run lower.
- AUDUSD 5M example
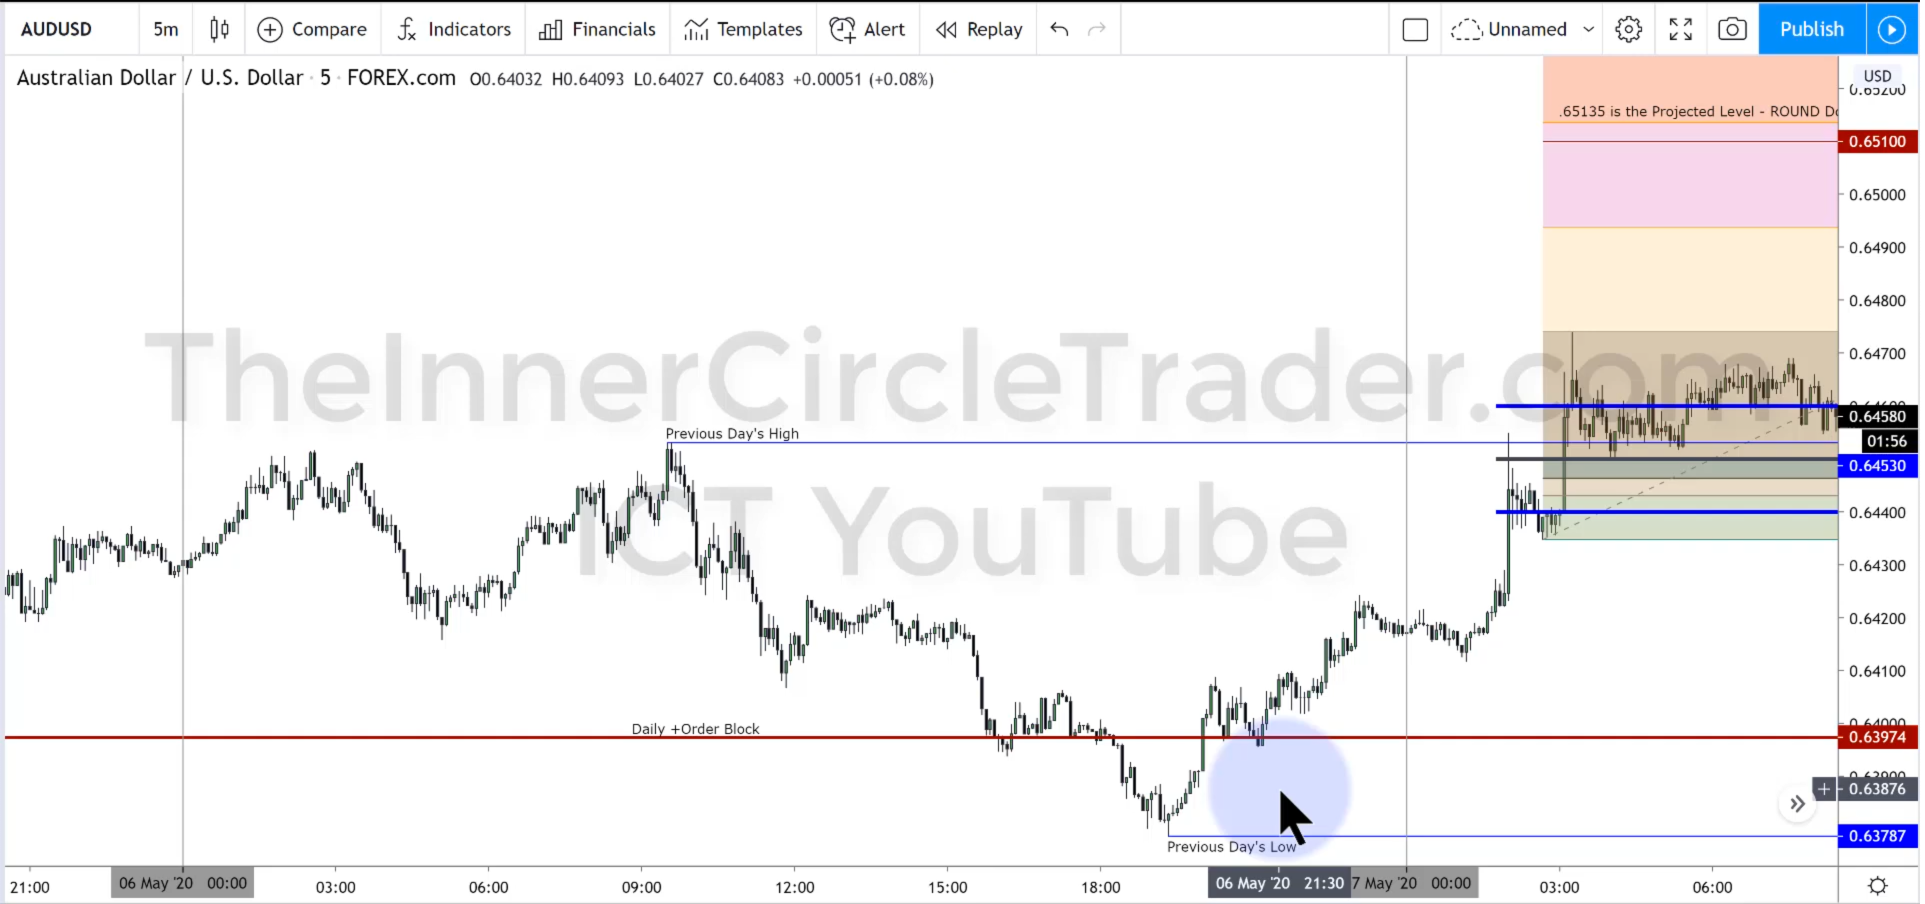
Mark out the previous days high and low.
The black line (6450) represents the closest institutional or key level near the previous days high. The blue lines above and below are a 10 pip spread.
- The OTE pattern occurs during the 8:30 to 11:00am NY session. That's when the major news and reports tends to come out.

The green box represents the 62 to 79% Fib retracement levels in the OTE pattern
- The Fib box is drawn from the low to high when the previous days high has been broken.
- Trade
- lot size that allows taking the partials (0.04, take a bit off each time?
- SL will be set below the 100 level.
- Profit taking
- take at 1st scaling at -0.5 or 15 pips or more
- take next at -1.0 or 15 pips or more (or slightly before - round down to the nearest 10 level)
- take a scaling at 100 pips regardless of where you are
- take next at -1.5
- take next at -2.0
- once price moves beyond the 1st scaling, move the SL up (just beyond BE)
- 2nd scaling - move SL above SL.
- other scalings - watch the trades, then set SL beyond BE, not to close so there is room for the trade to run.
- get out by the last scaling
- Fib settings for Trading View:

We could also at -1.5 level
- key things learned
- when to move a stop
- what entry price to look for
- where stop loss should be
- where do you take partials
- what you avoid doing to your revised stops (choking them out)
[top]
Example 2 - USDJPY
- Daily Chart
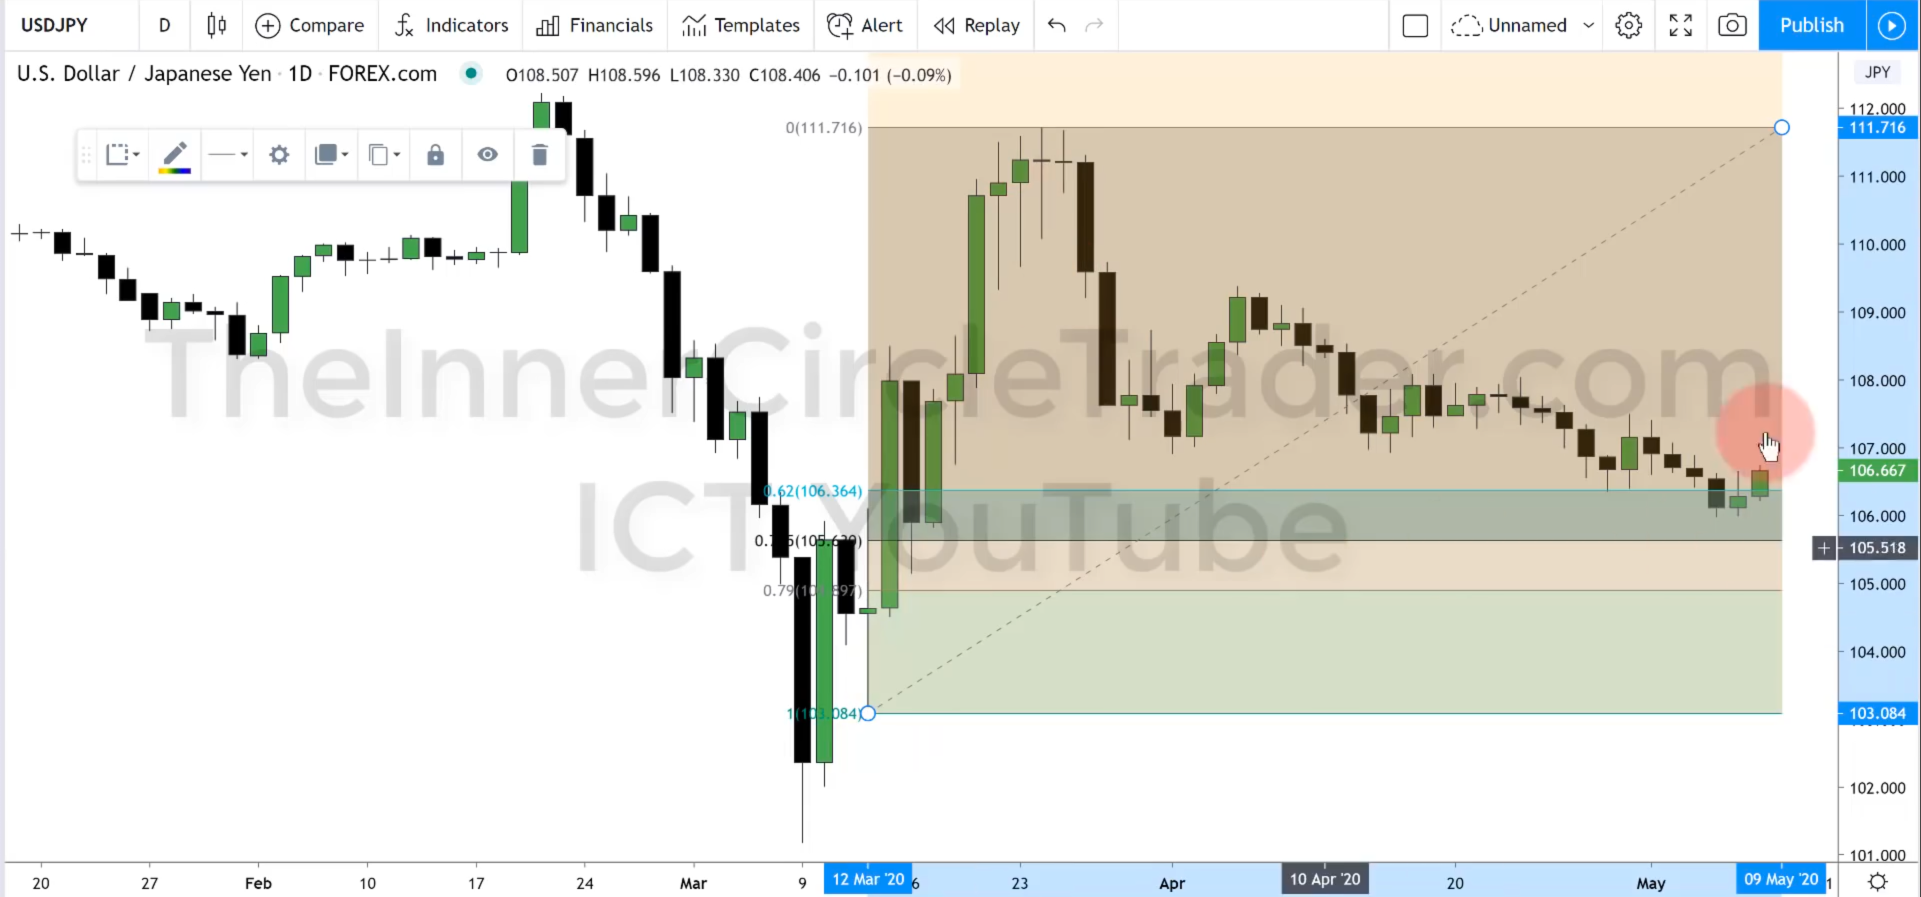
fib drawn from the swing low, to the swing high
- previous days high (2nd last candle) broke the high from the day before that. This means we could potentially see a turn, or an expansion to the upside
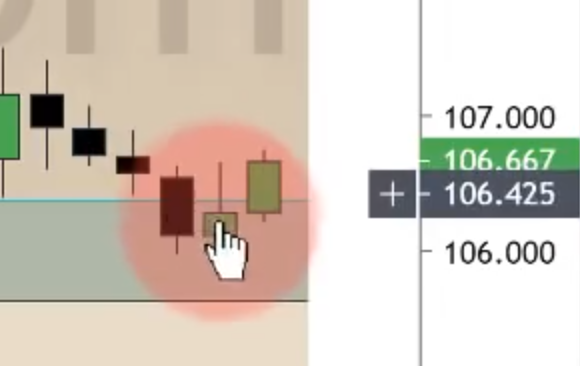
Our high is 106.65(7)
- Dropping into the 5m chart:
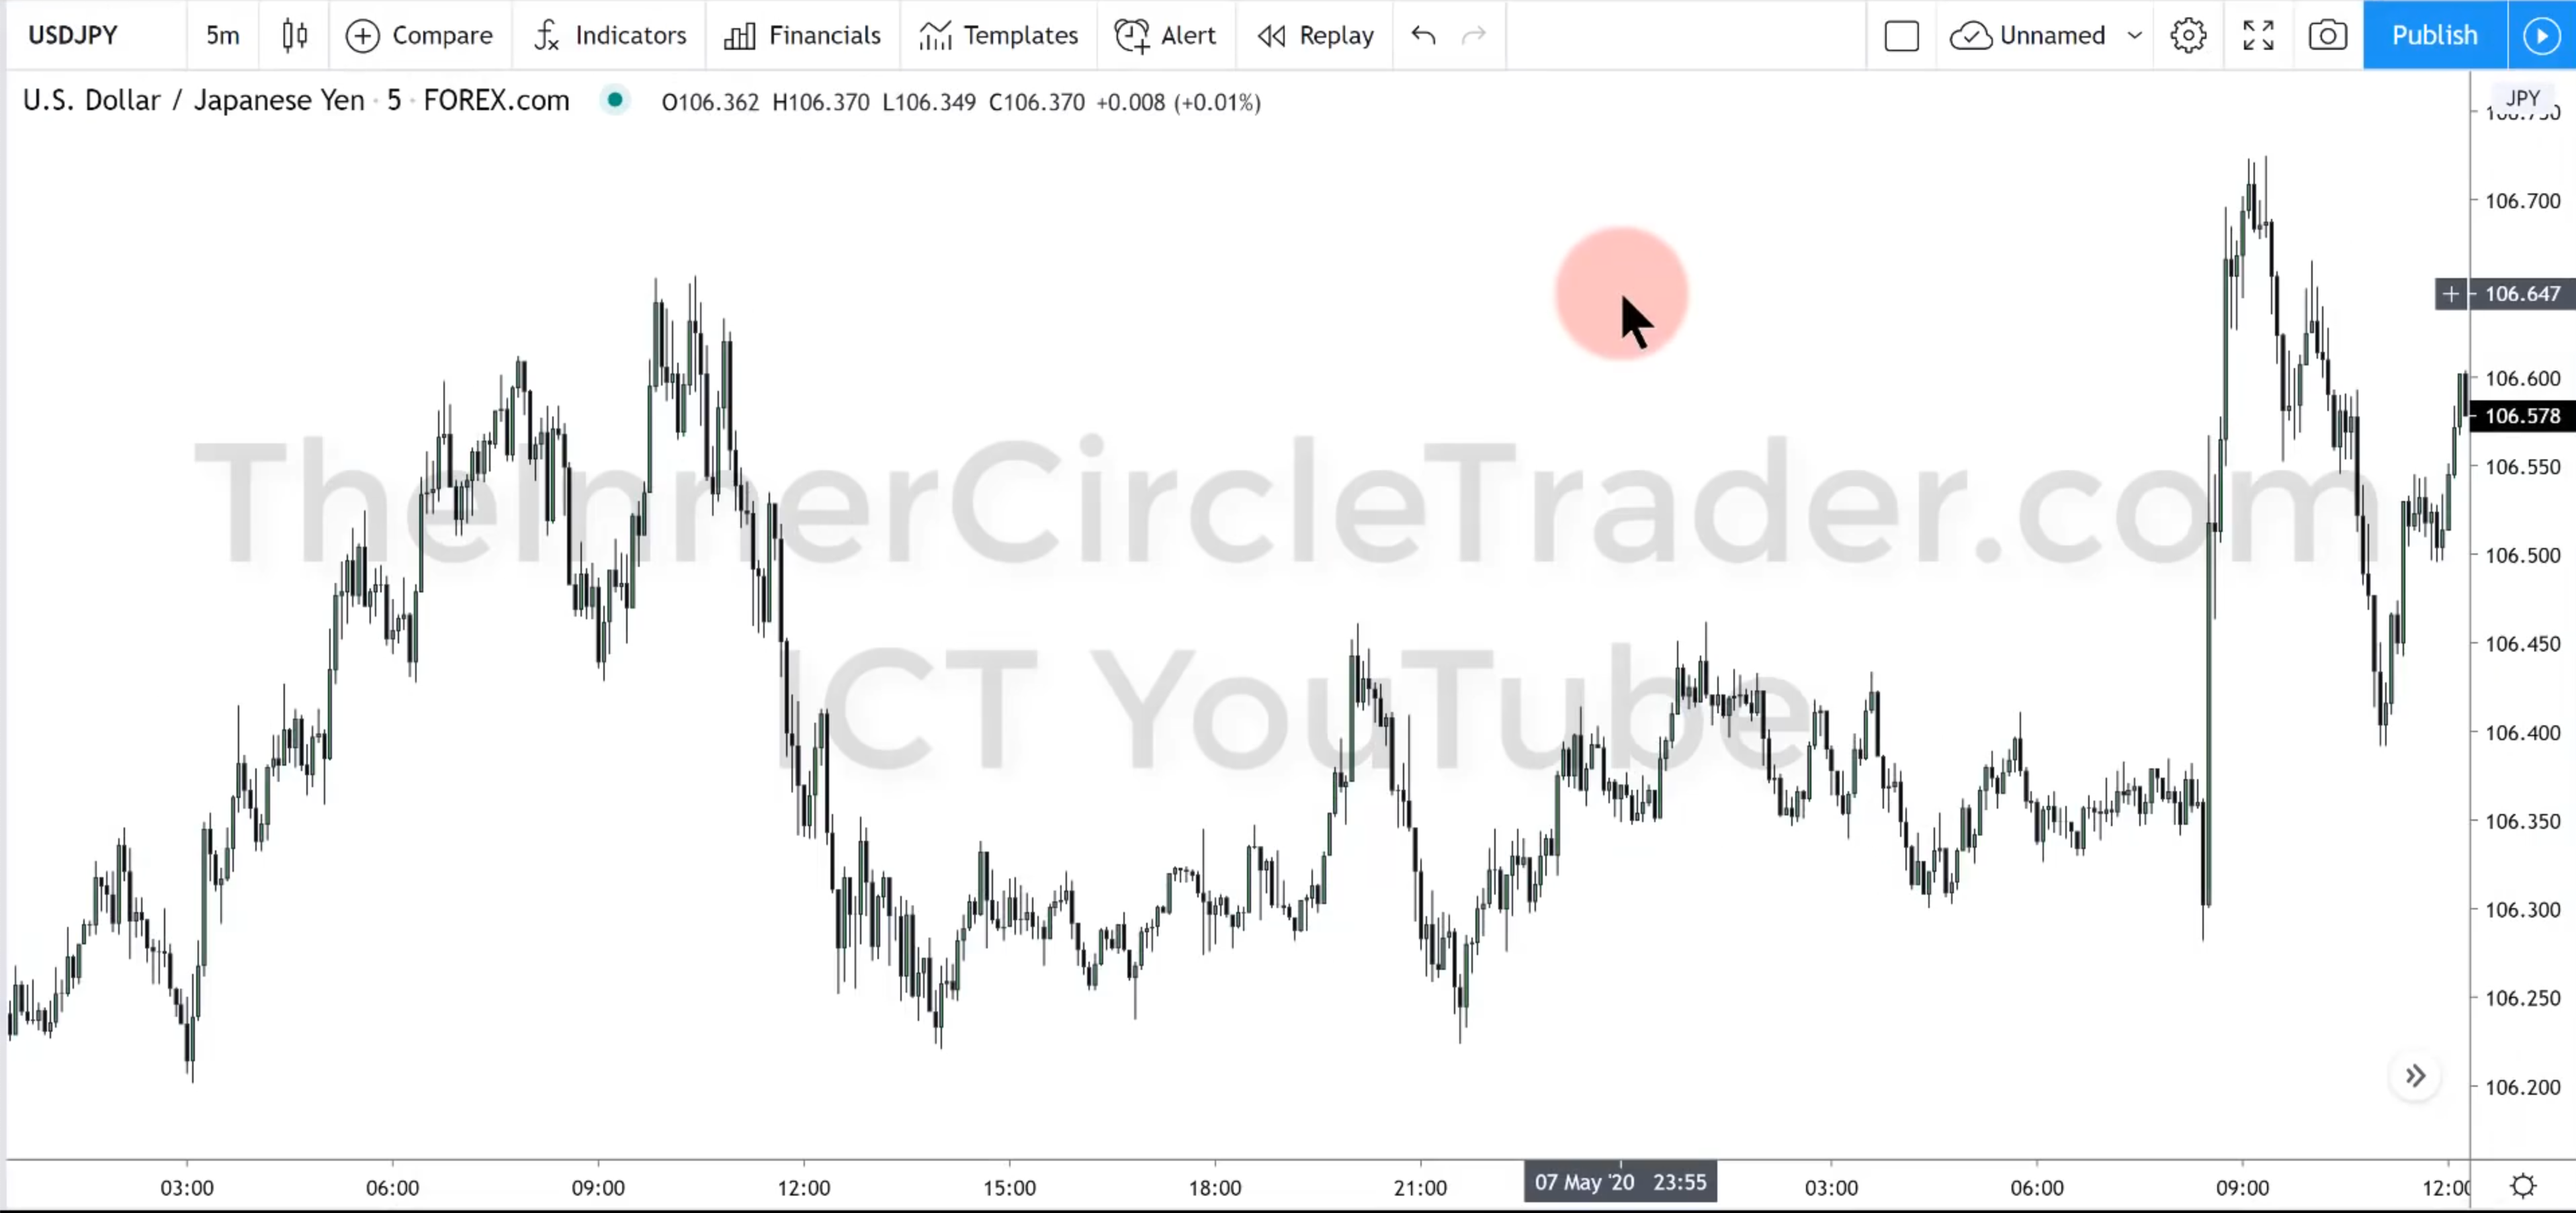
Where do you think the OTE is going to be? Look before scrolling further. Remember the magic hours of 08:30 - 11:00 NY time.
- Fib added from the previous low at point 1, to the last recent high at point 2
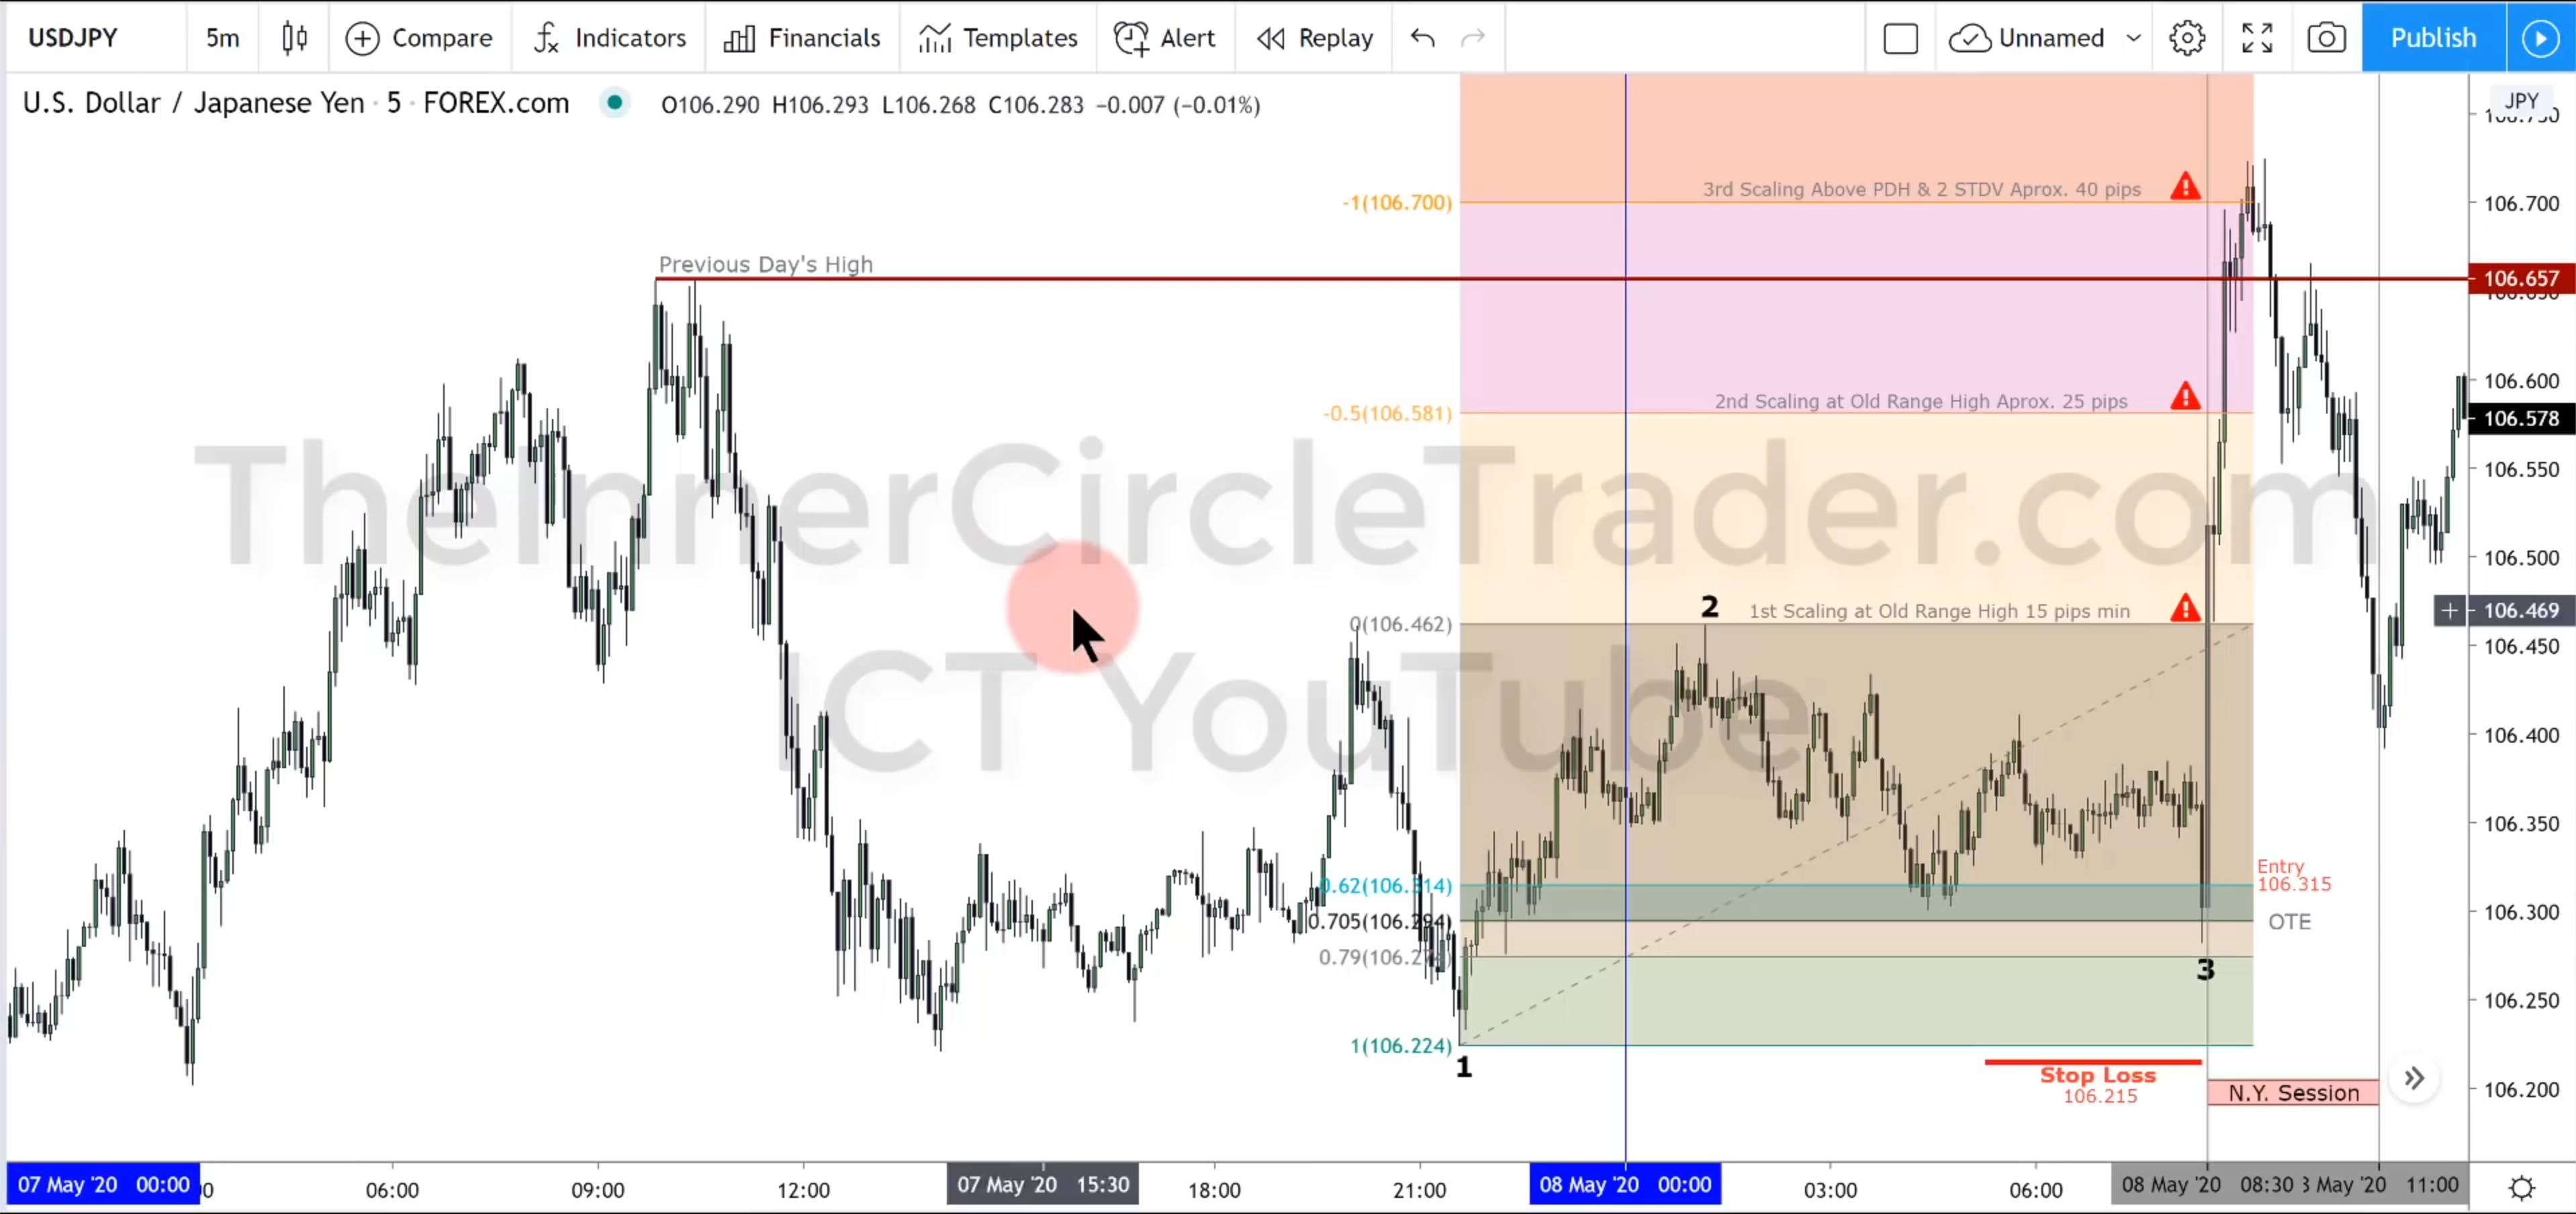
- Trading View chart, 15m
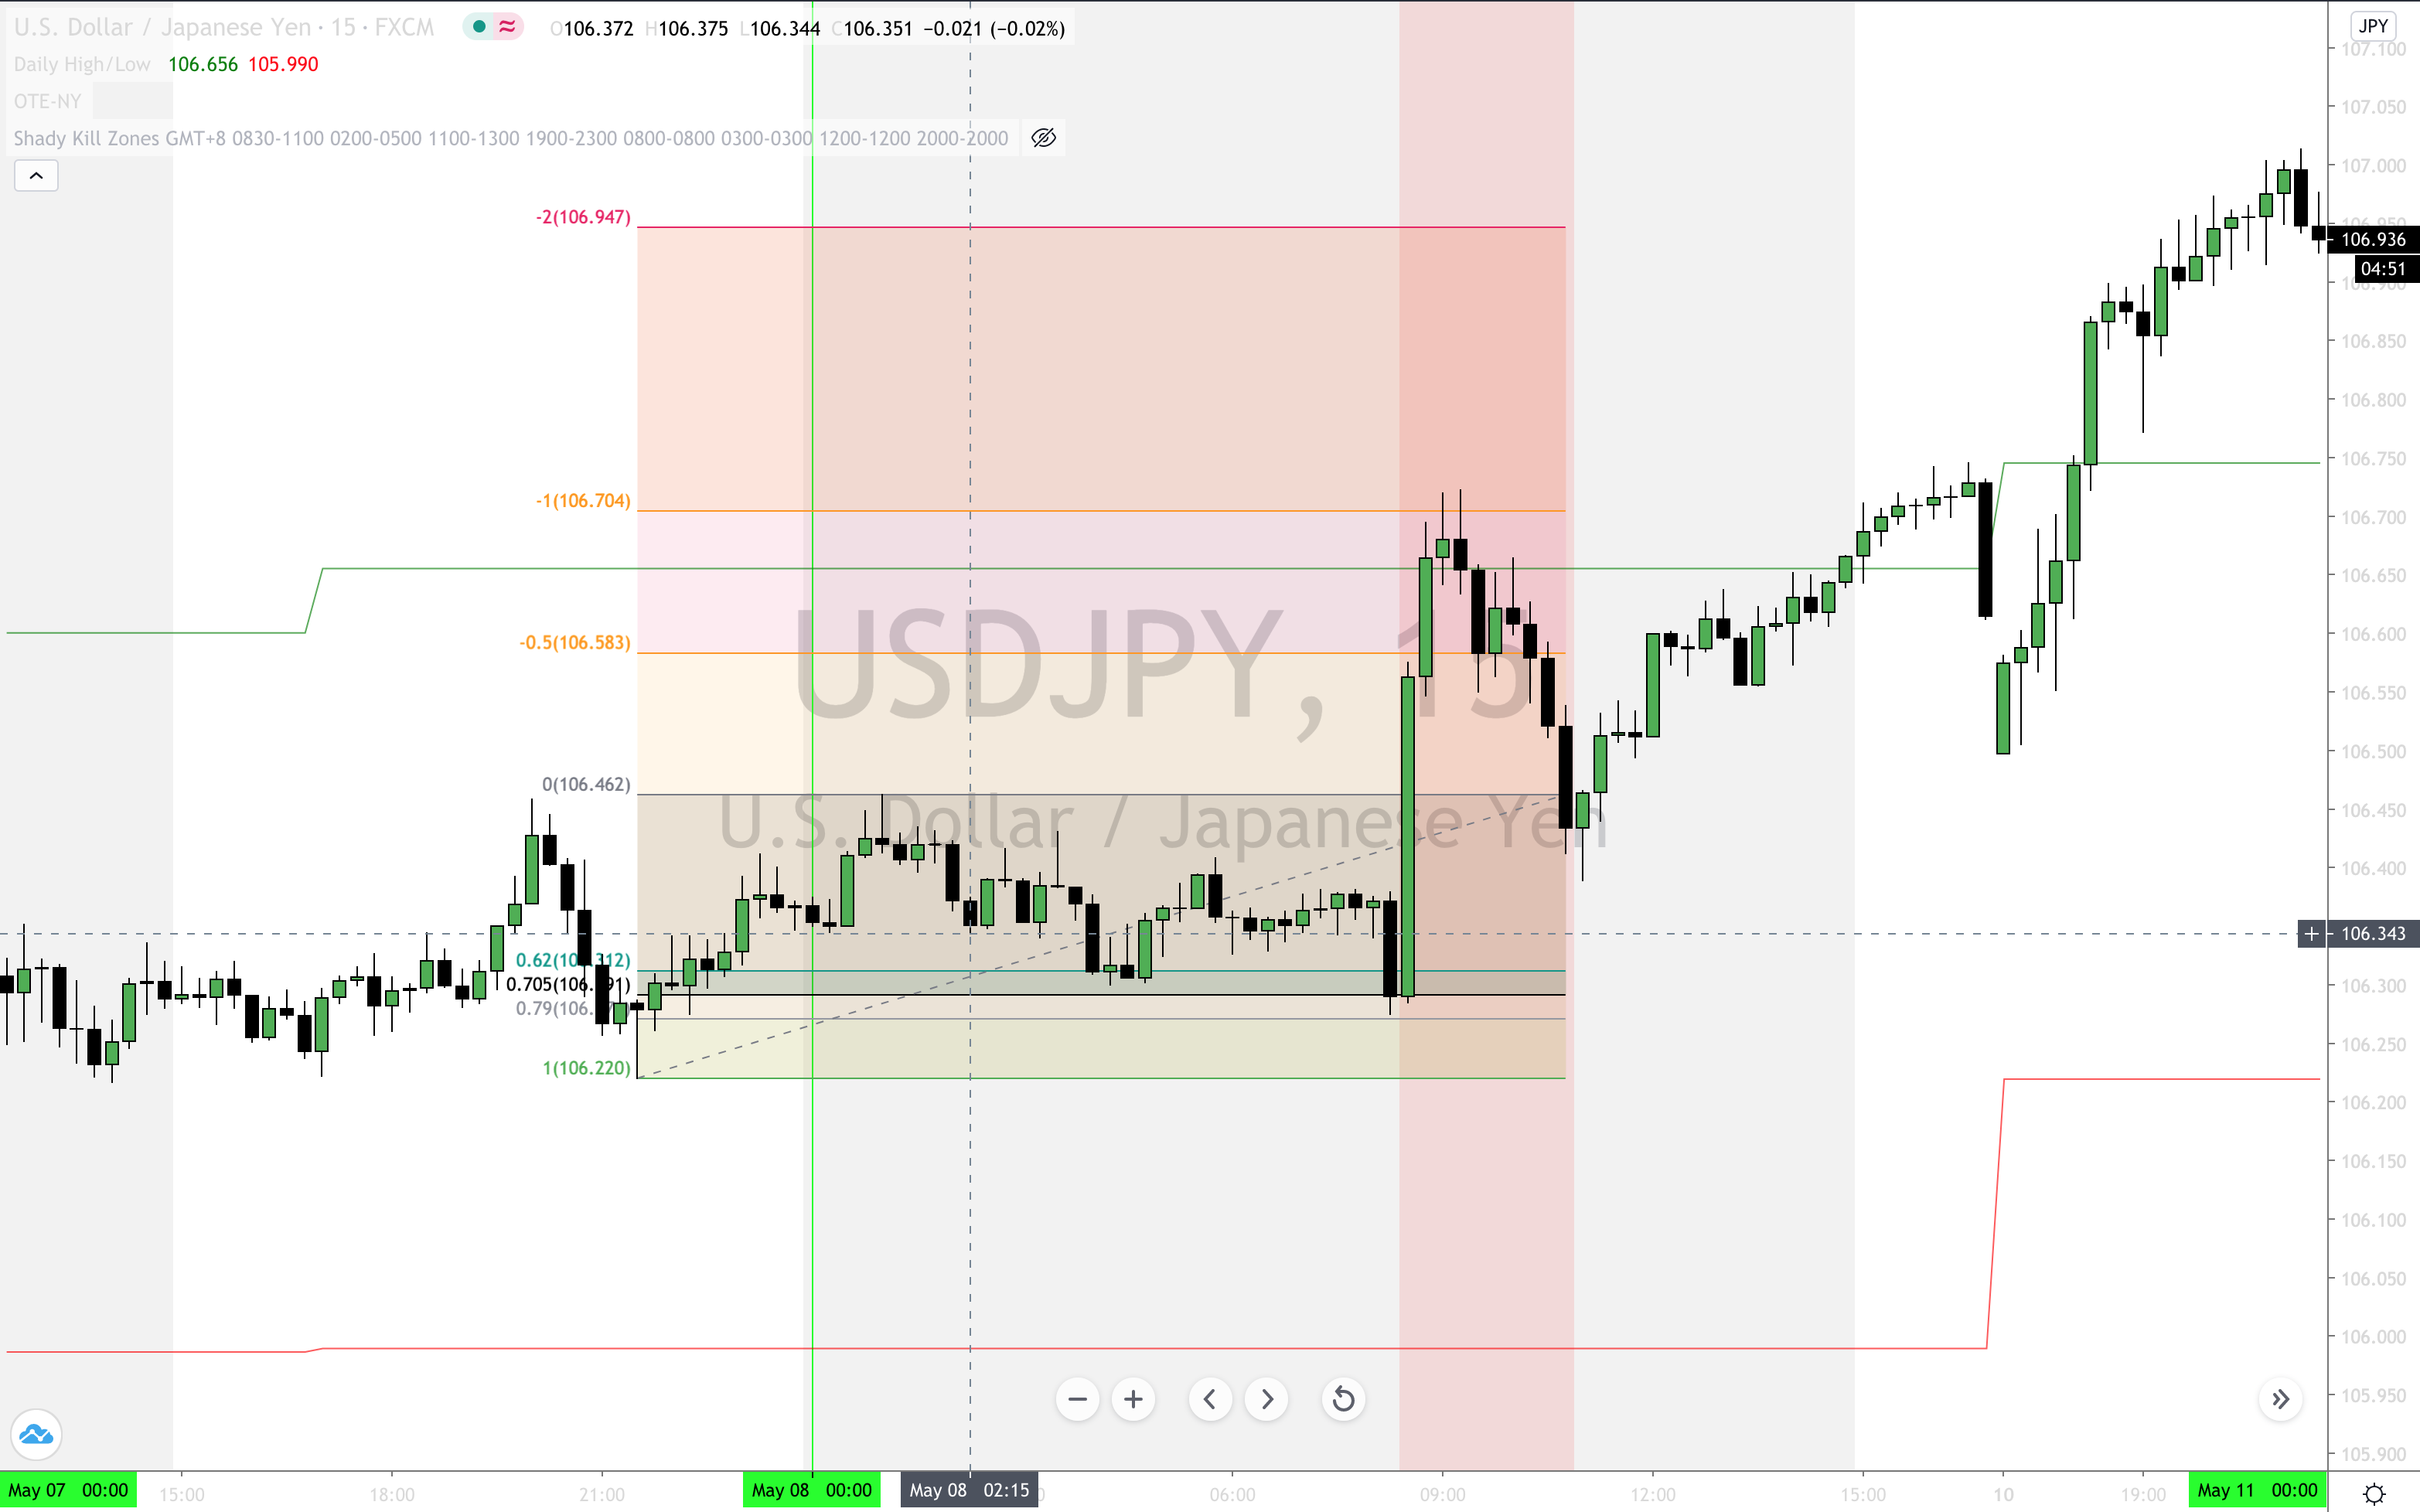
- On the above chart is a second OTE occurring just after the OTE period opening
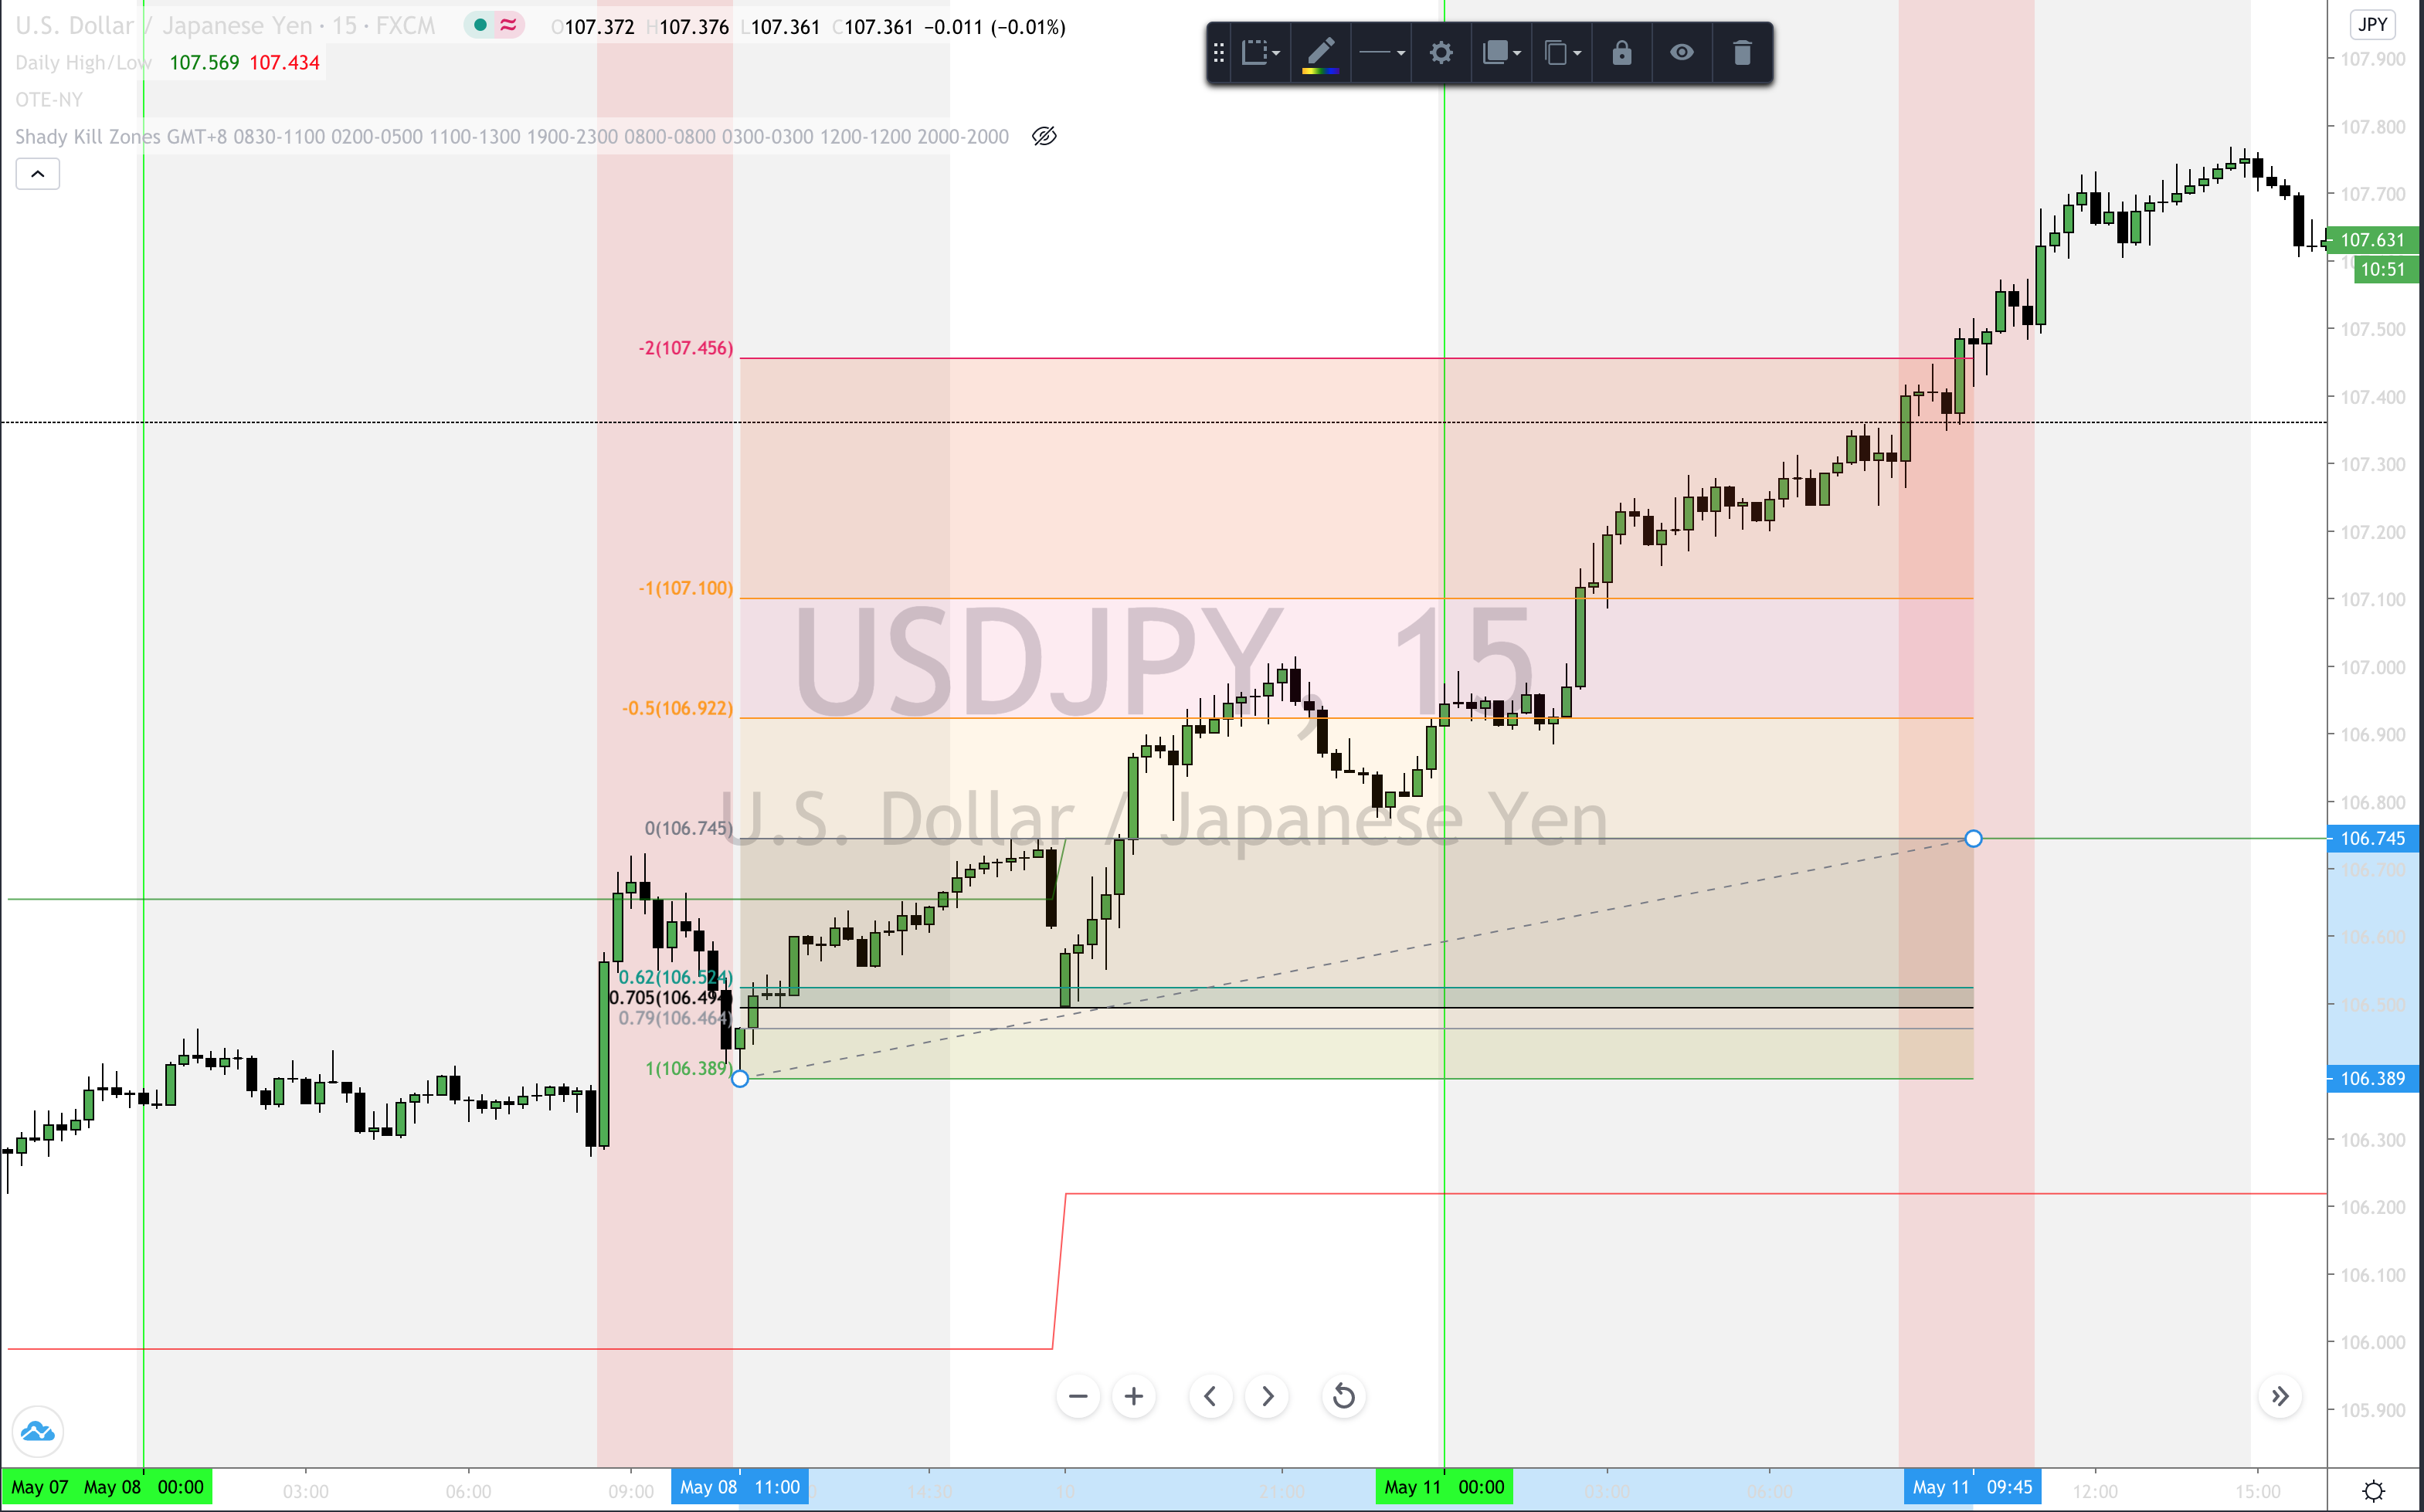
From the swing low, to the new high breaking the previous high. The OTE opportunity crosses the weekend.
- 5m chart view

the recent low marked, right side showing the new high forming the OTE pattern.
[top]
Example 3 - S&P 500 E-Mini Futures (June 2020)
- Daily Chart
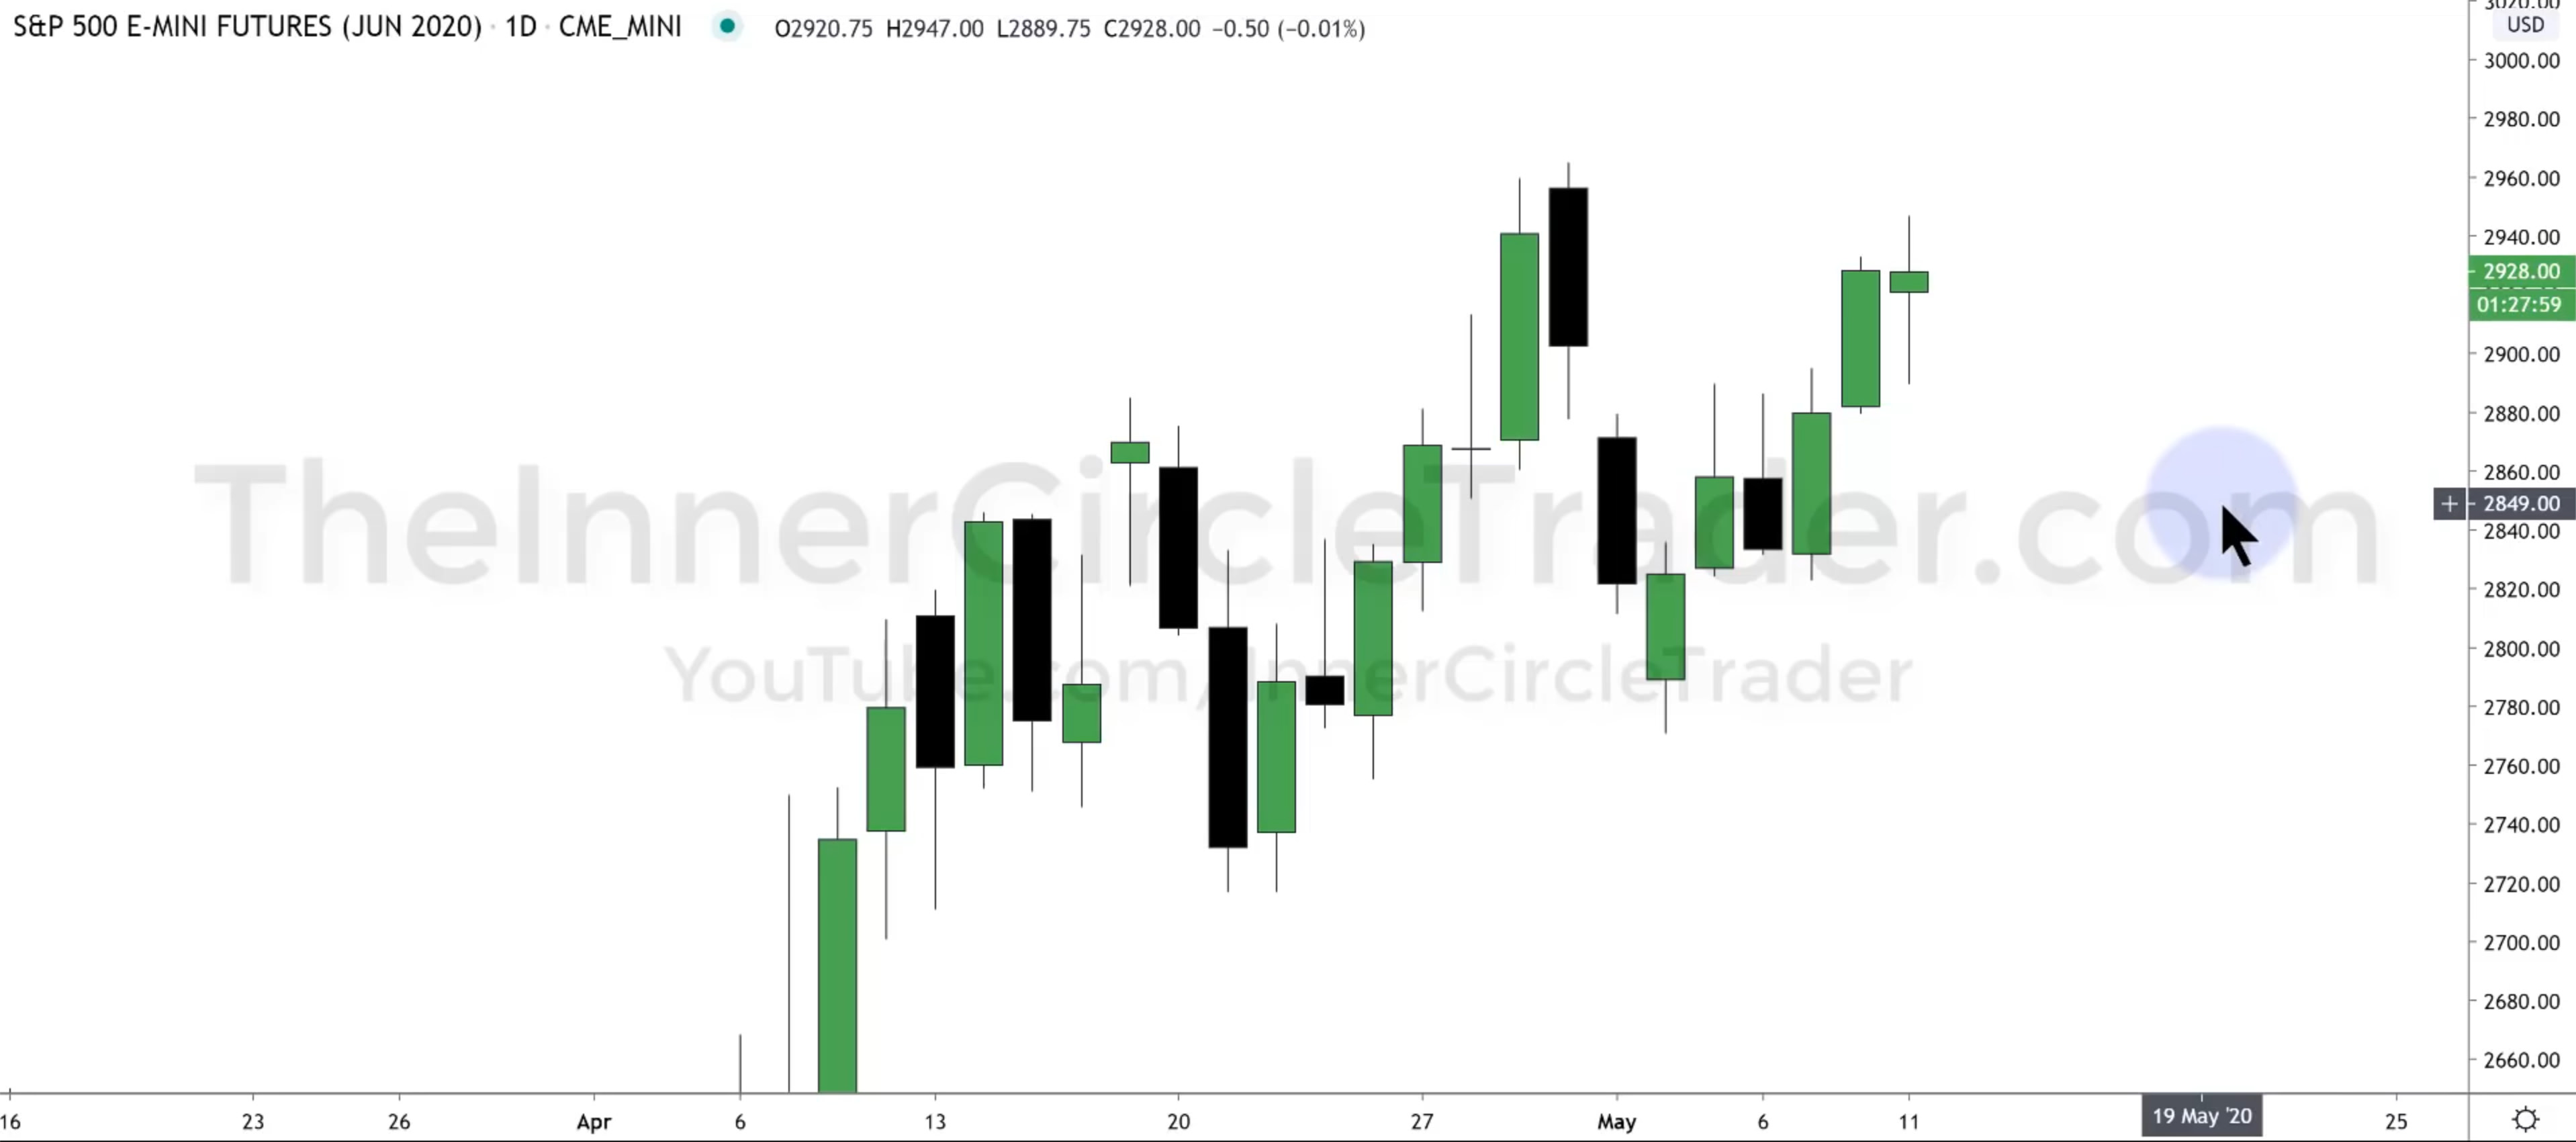
- currently inside of an OTE

The fib provides a framework - old low, old high, retracement back to the 79 level. On the daily chart, the momentum is likely to go higher. It could be reaching for the old high, it could break through, or it could fail. It doesn't matter.
What we do care is that it is likely to run the previous day's high.
- Previous day's high marked

- 5m chart
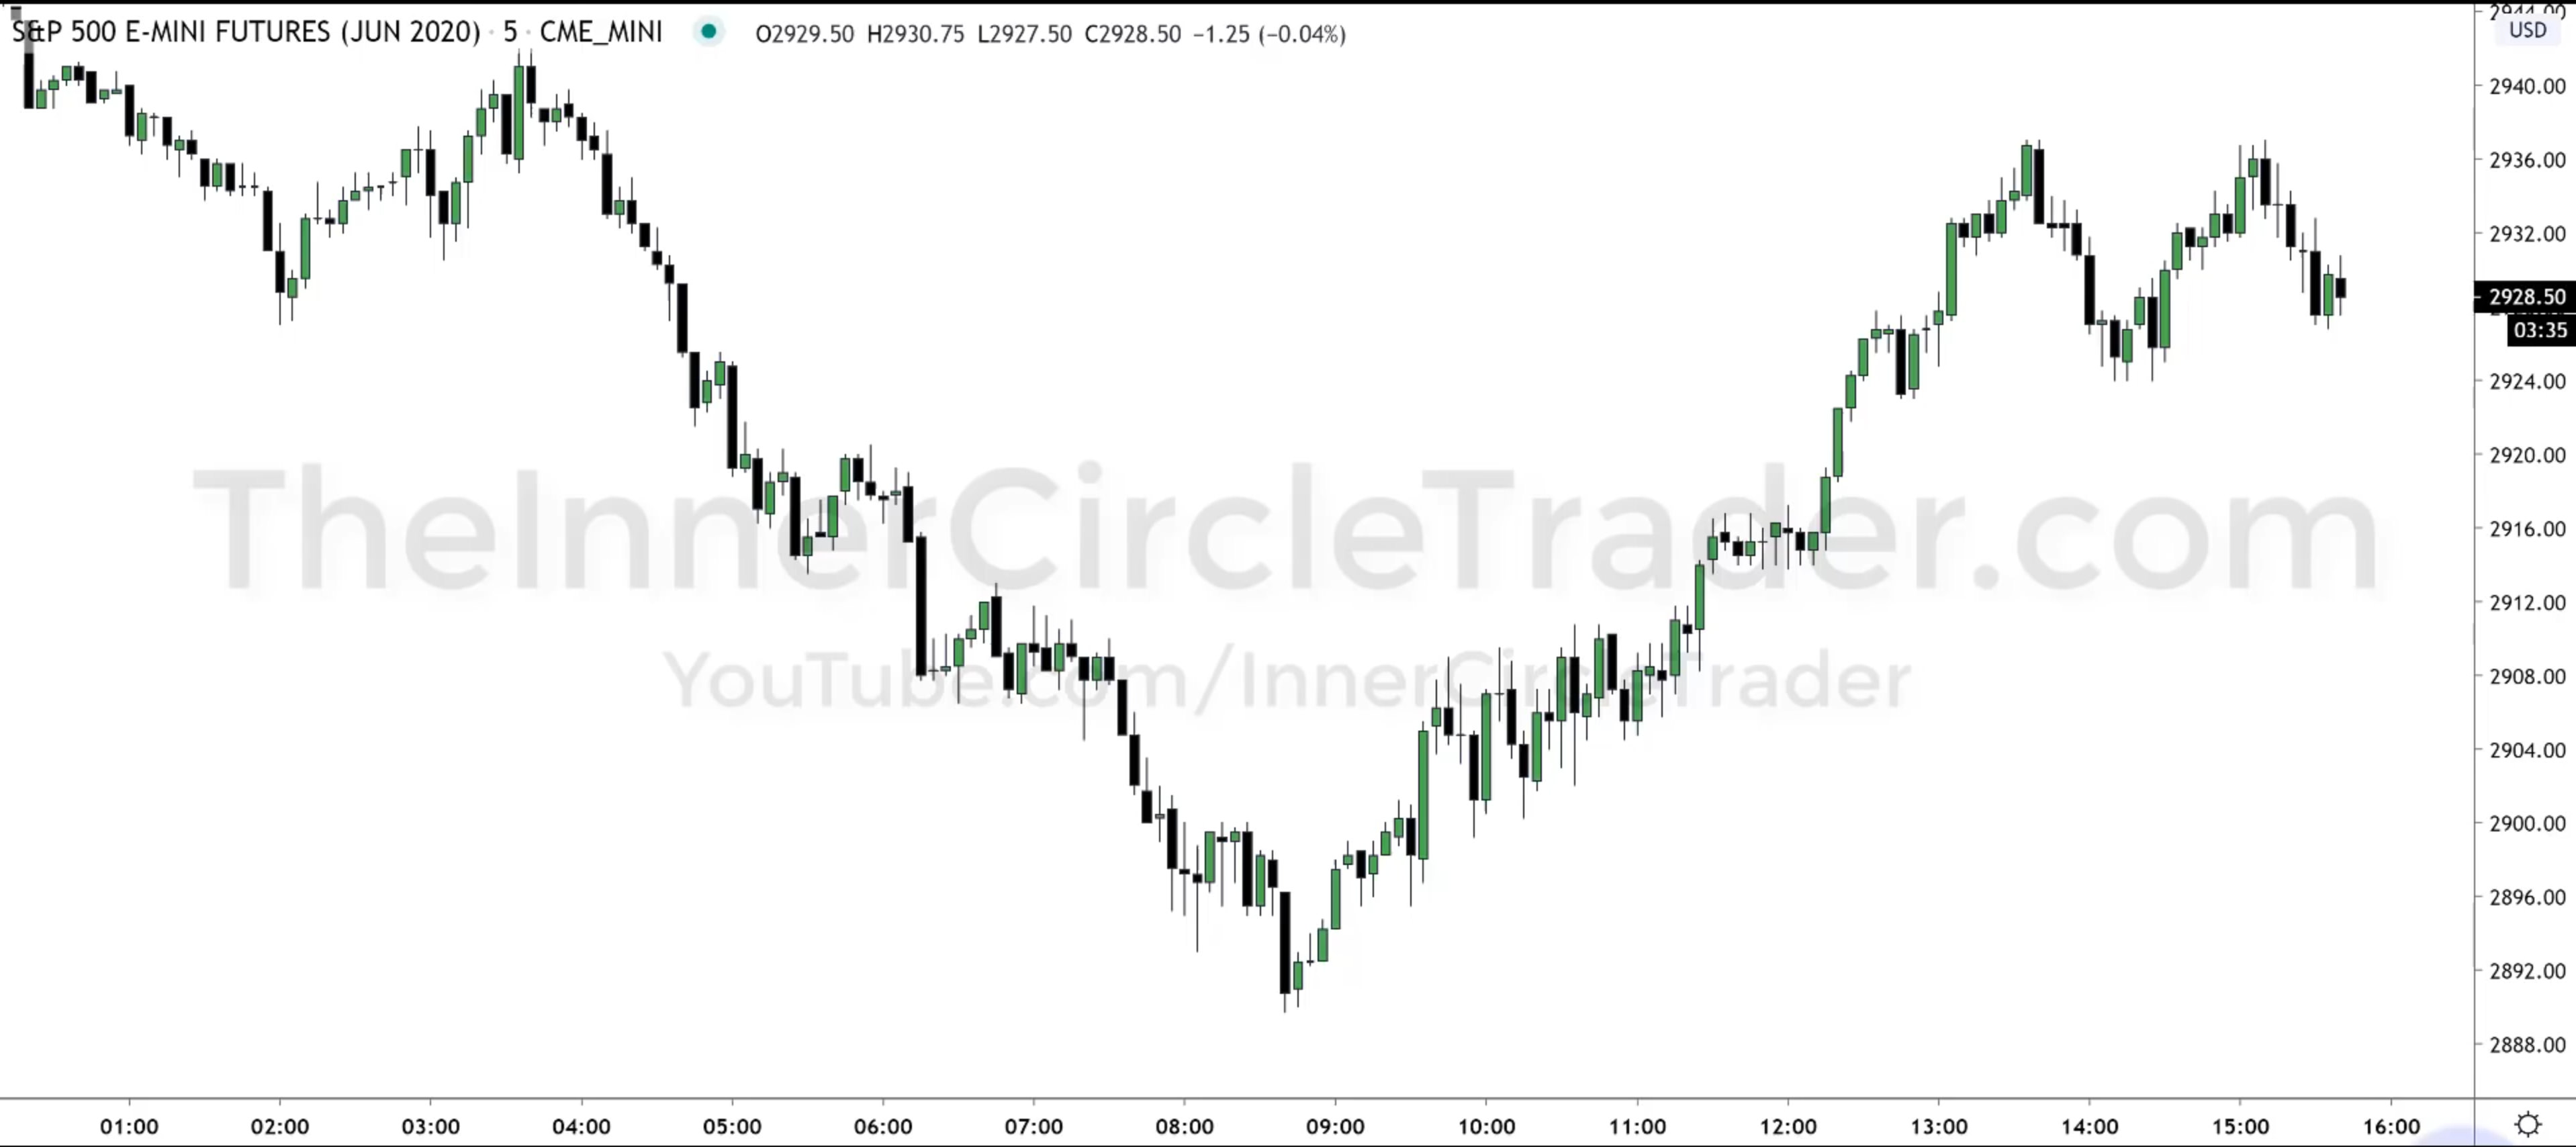
- Marked up
The "big figure" is 2900. Price has traded down into that during the NY session. Whenever a big figure is swept, either down into, or up into, it generally creates a tradeable bounce or retracement, even if it is very short lived.
- Focus on the NY session time to find the OTE

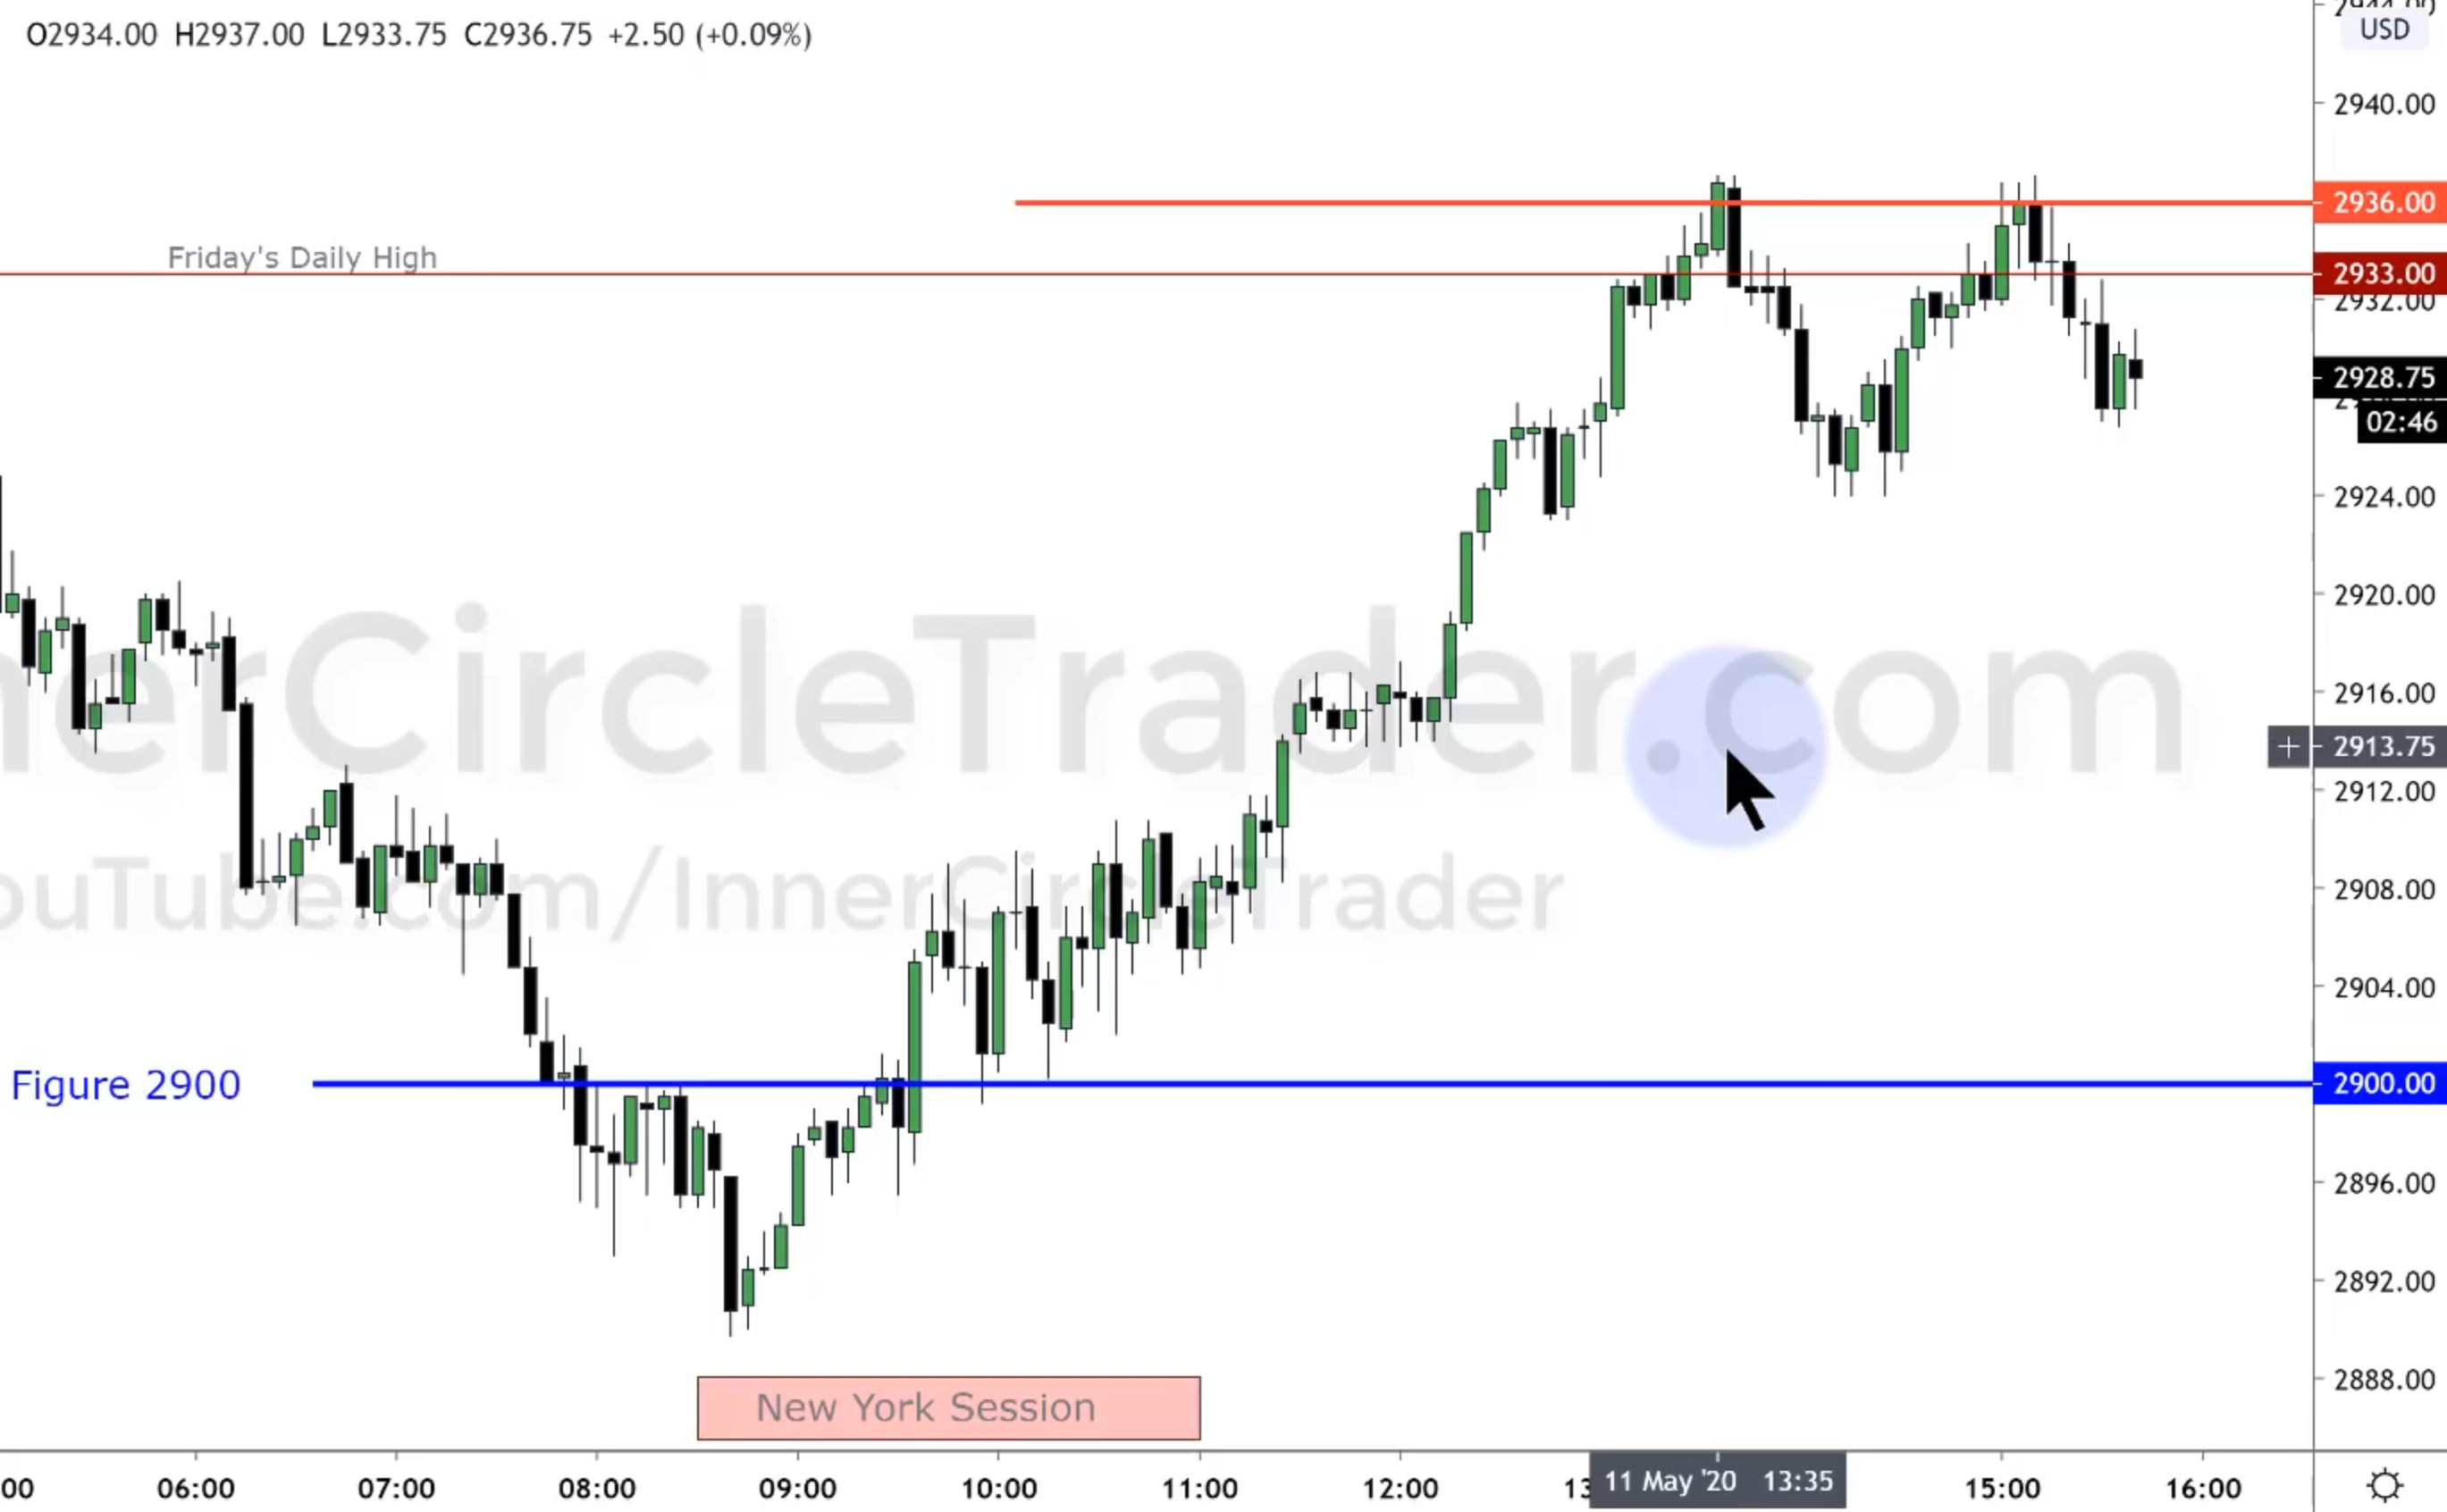
- OTE marked

- and here is how it played out
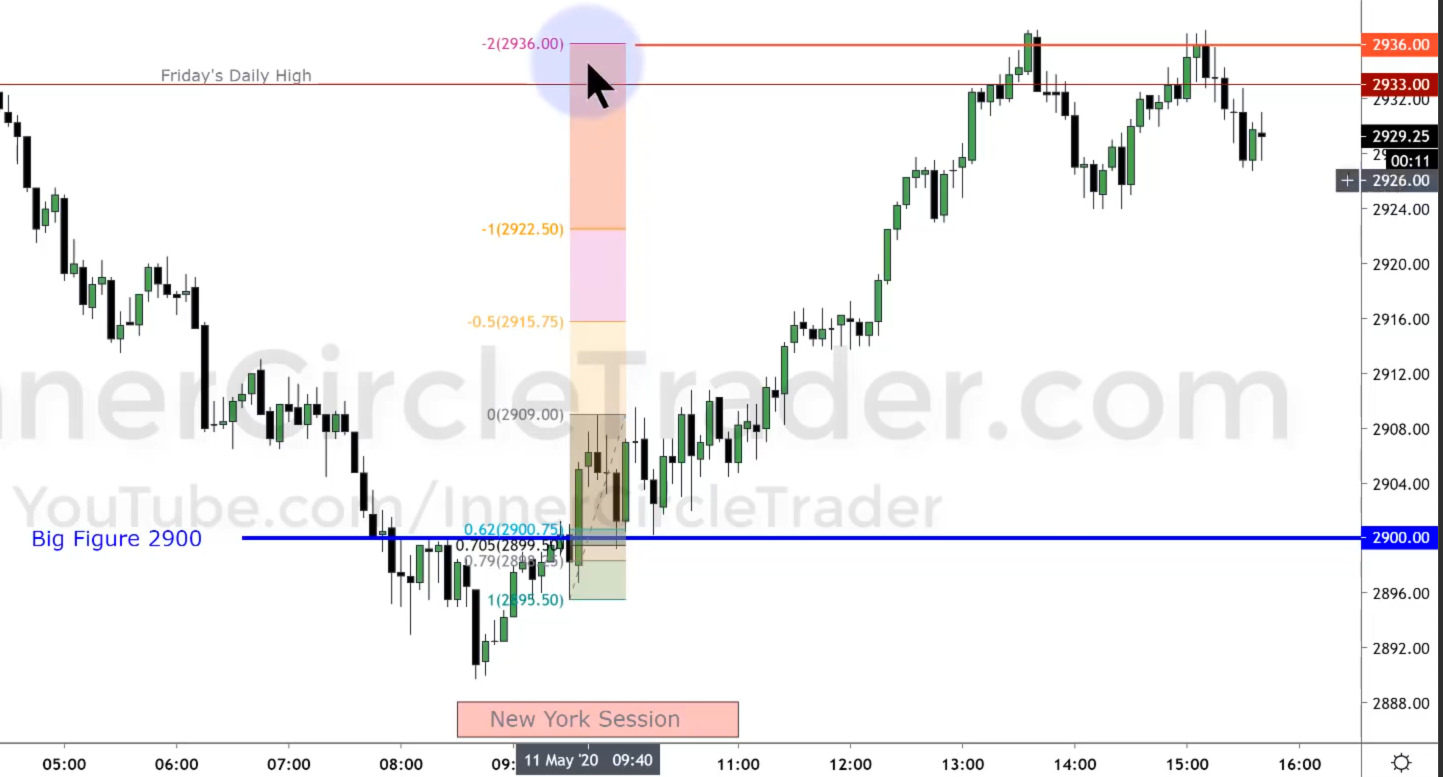
In this example, the market tends to want to gravitate towards the old high because the market is bullish, and will catch out the market short sellers.
[top]
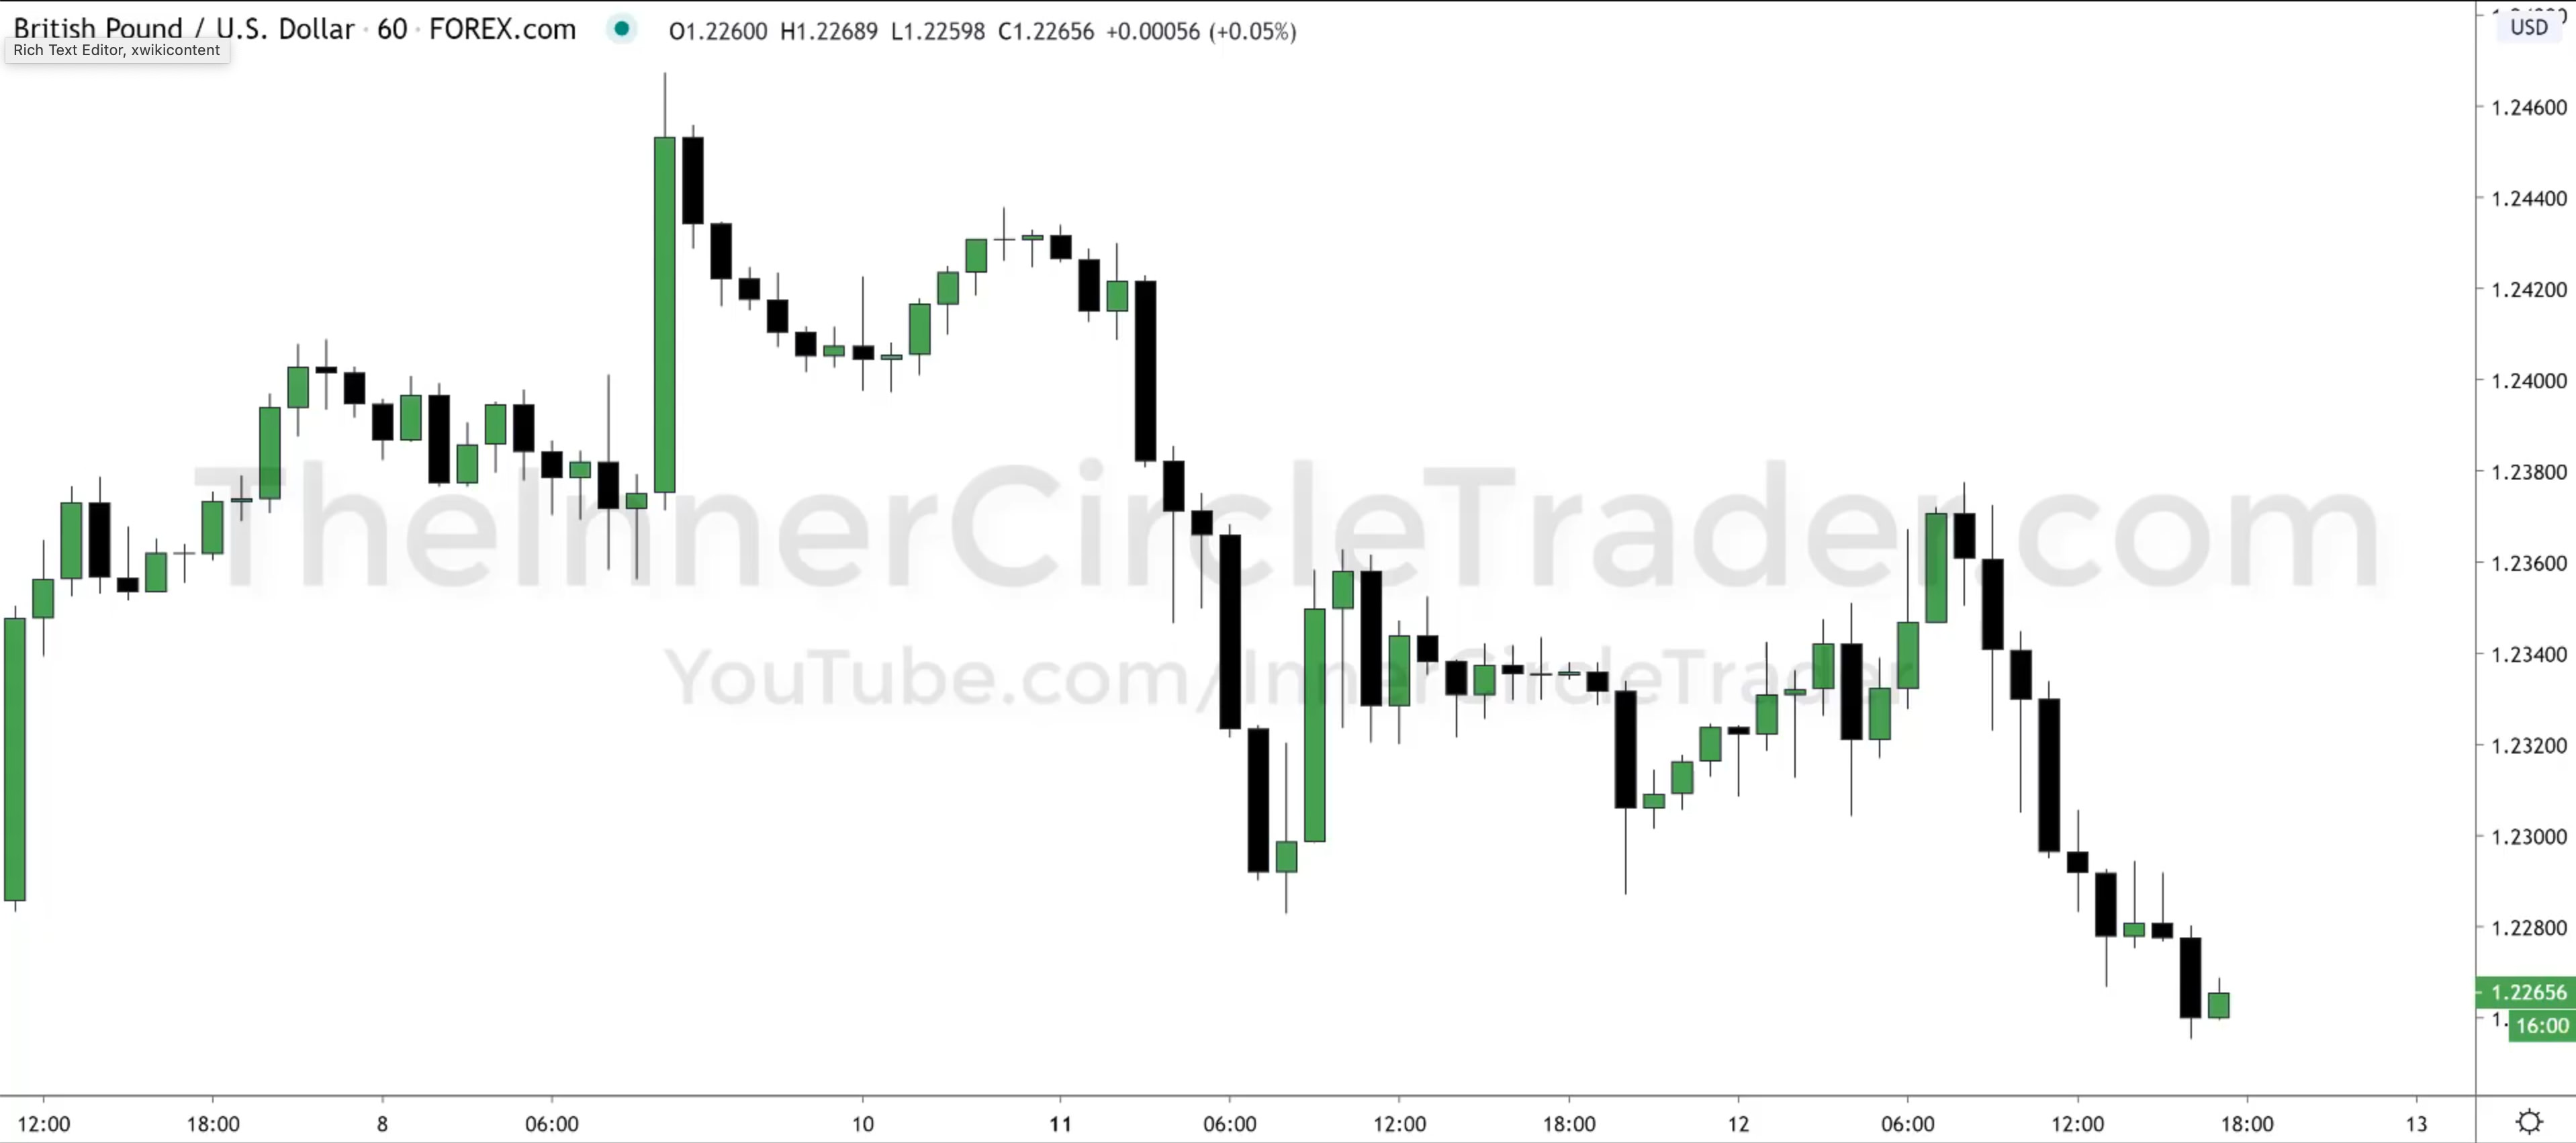
Example 4 - GBPUSD
- 1H chart
- Marked up using "support and resistance" paradigm. Note that this is a retail trading mindset and it is wrong.
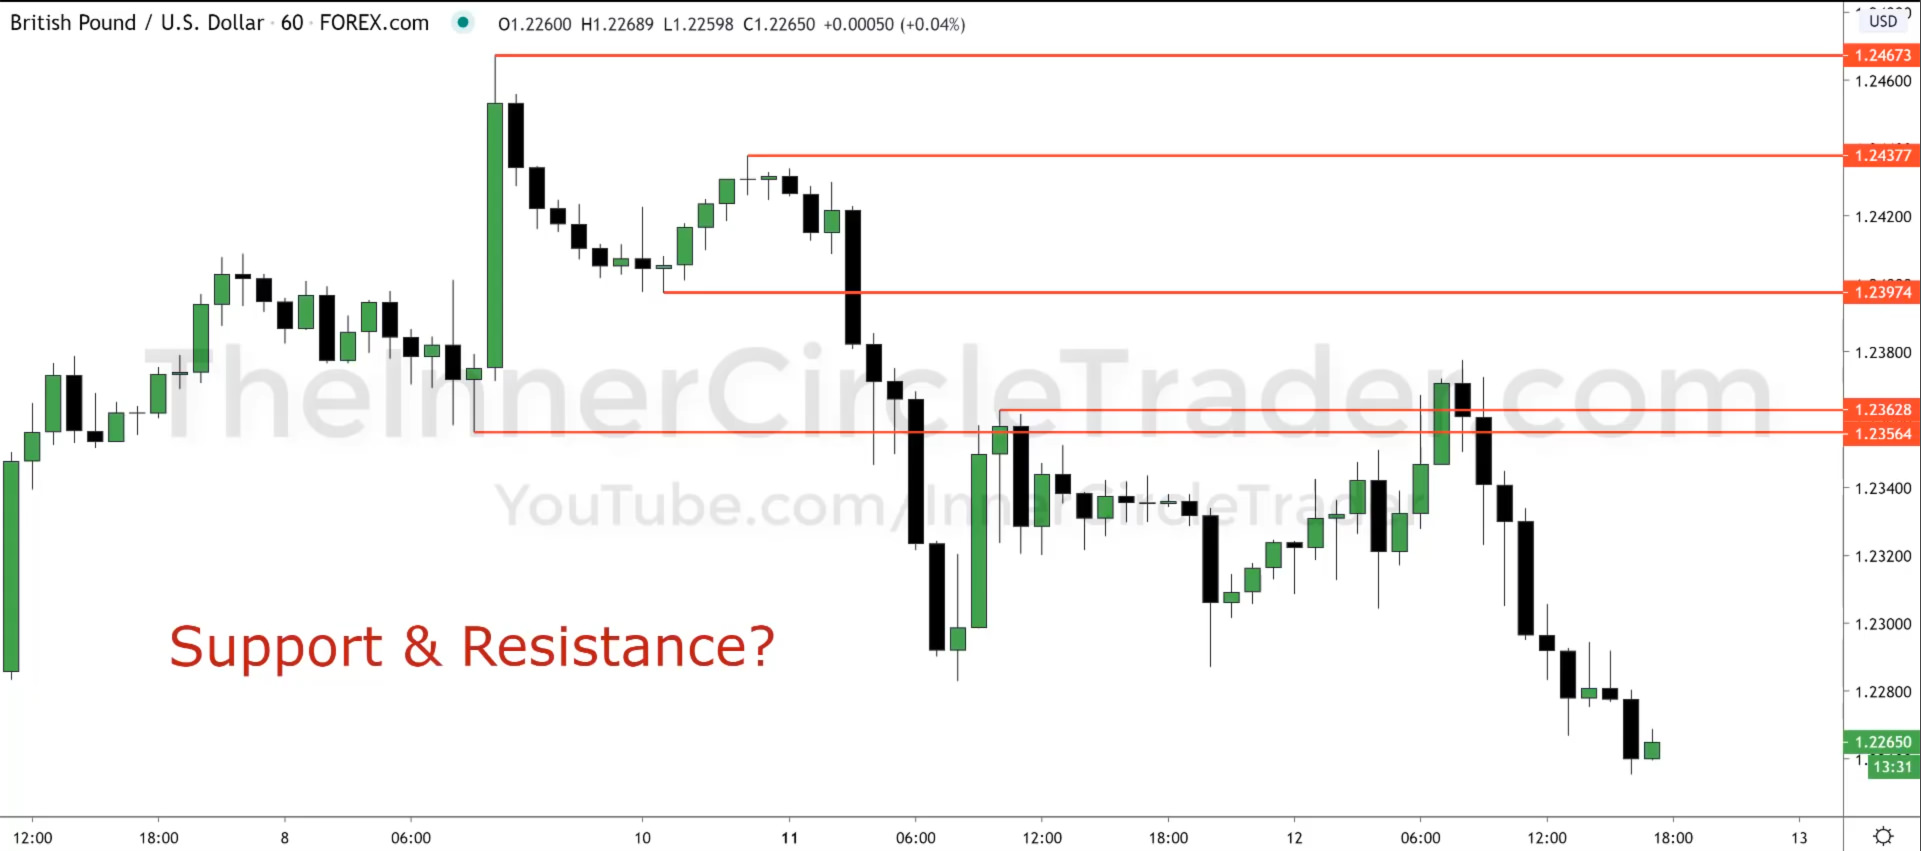
Again. Wrong.
- ICT Markup - [Market Efficiency Paradigm] (link to definition later)
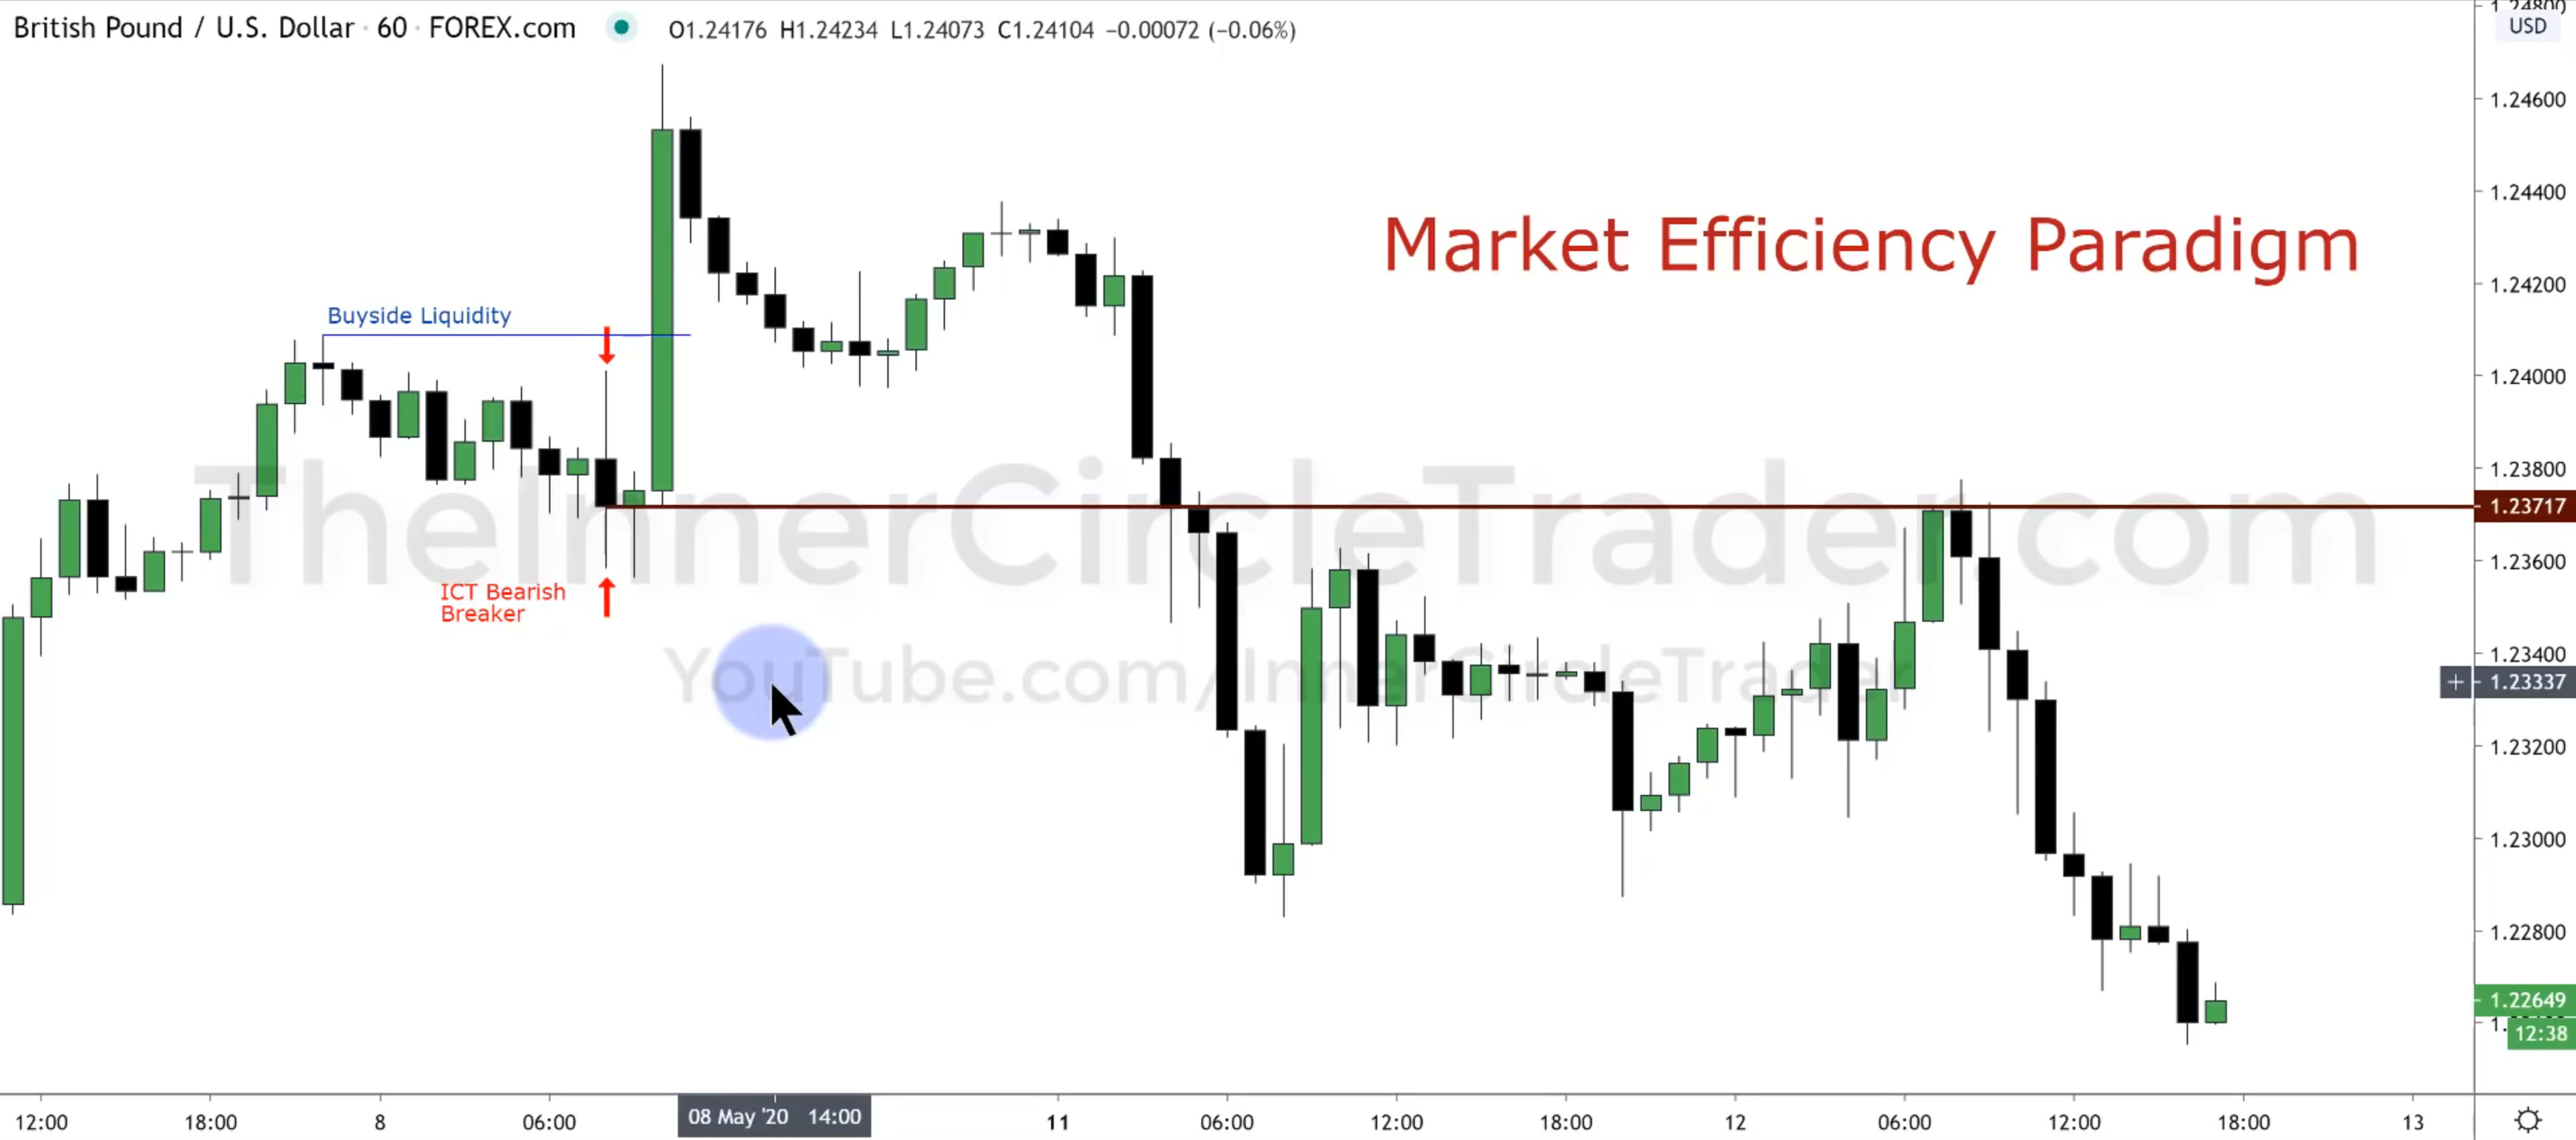
It's basically the narrative of why price goes where it does and why it reacts the way it does when it gets there and where it is reaching to next. The ICT Bearish Breaker cuts to the whole narrative immediately.
Why? You want to look at price and look for areas where they run an old high because above that is going to be buy stops. And this is buy side liquidity. This could be in the form of buy stops for new long entries, or stops protecting existing shorts.
The big candle to the right runs through that zone to gather the liquidity. Also, ICT calls this candle pattern a "Judus Swing" because it's a fake move because it appears to signal a bullish move.
When we see these sharp runs that that run previous highs/lows, it's highly suspect to ICT. If we get back down below the lowest down candle (ICT Bearish Breaker), breaking that low (which it does in the 3-6am bull candles above), the narrative changes to Bearish.
So what we do is go to that Breaker, draw the line out in time and then you'll be able to see the real turning point, or the real support/resistance level if you like. Look at the 7-9am candles on the right where it touches the 1.2371 line.
- This provides the narrative behind finding and OTE with this structure in place. It can occur in a trendless market environment, and doesn't have to have a bullish or bearish trend on the daily chart, so go into the lower timeframes.
- 1h chart marked up showing the previous days low as our highlighted candle is a ICT Bearish Breaker and tends to indicate that we are going for new lows and it is likely we will target the previous days low.
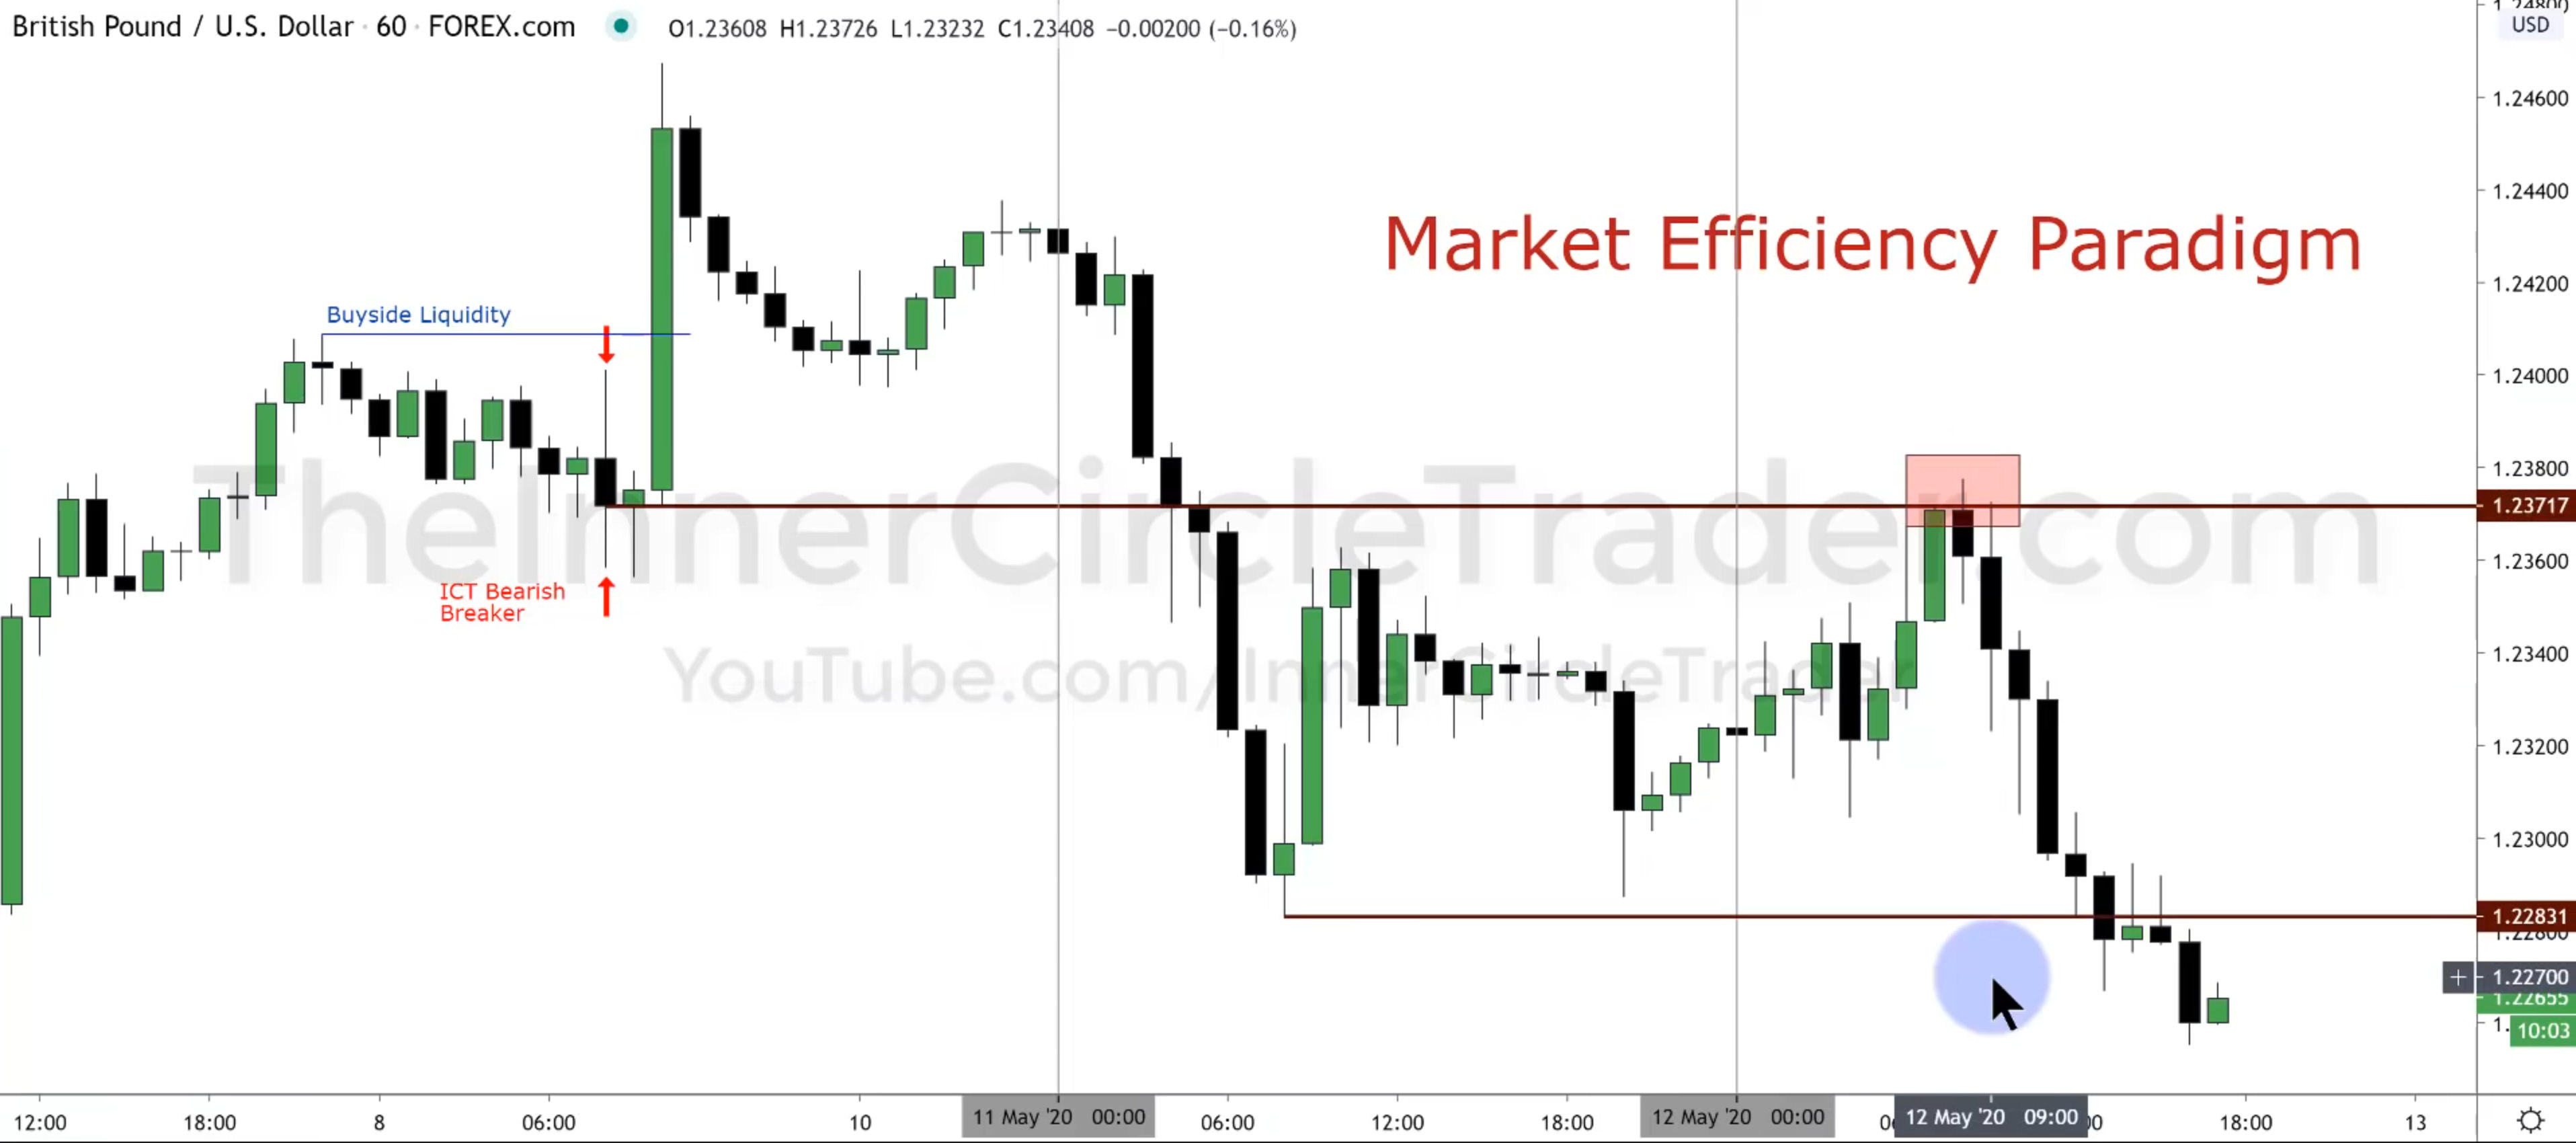
The new ICT bearish breaker is highlighted in the pink box.
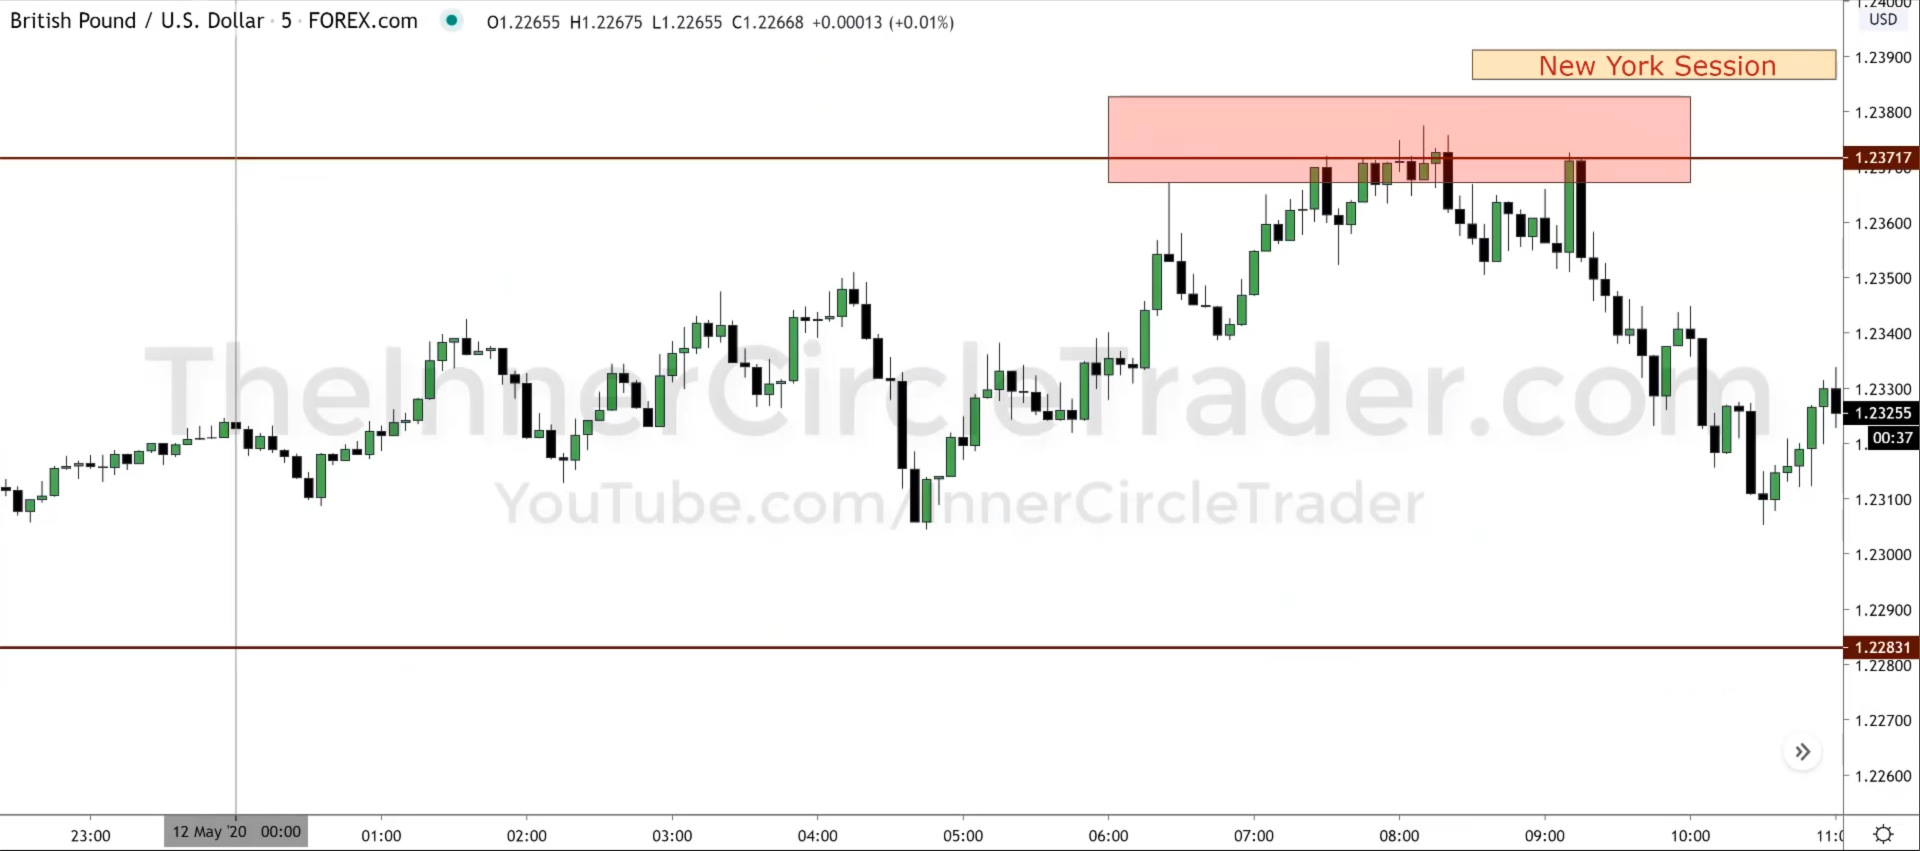
- 5m with the NY Session highlighted
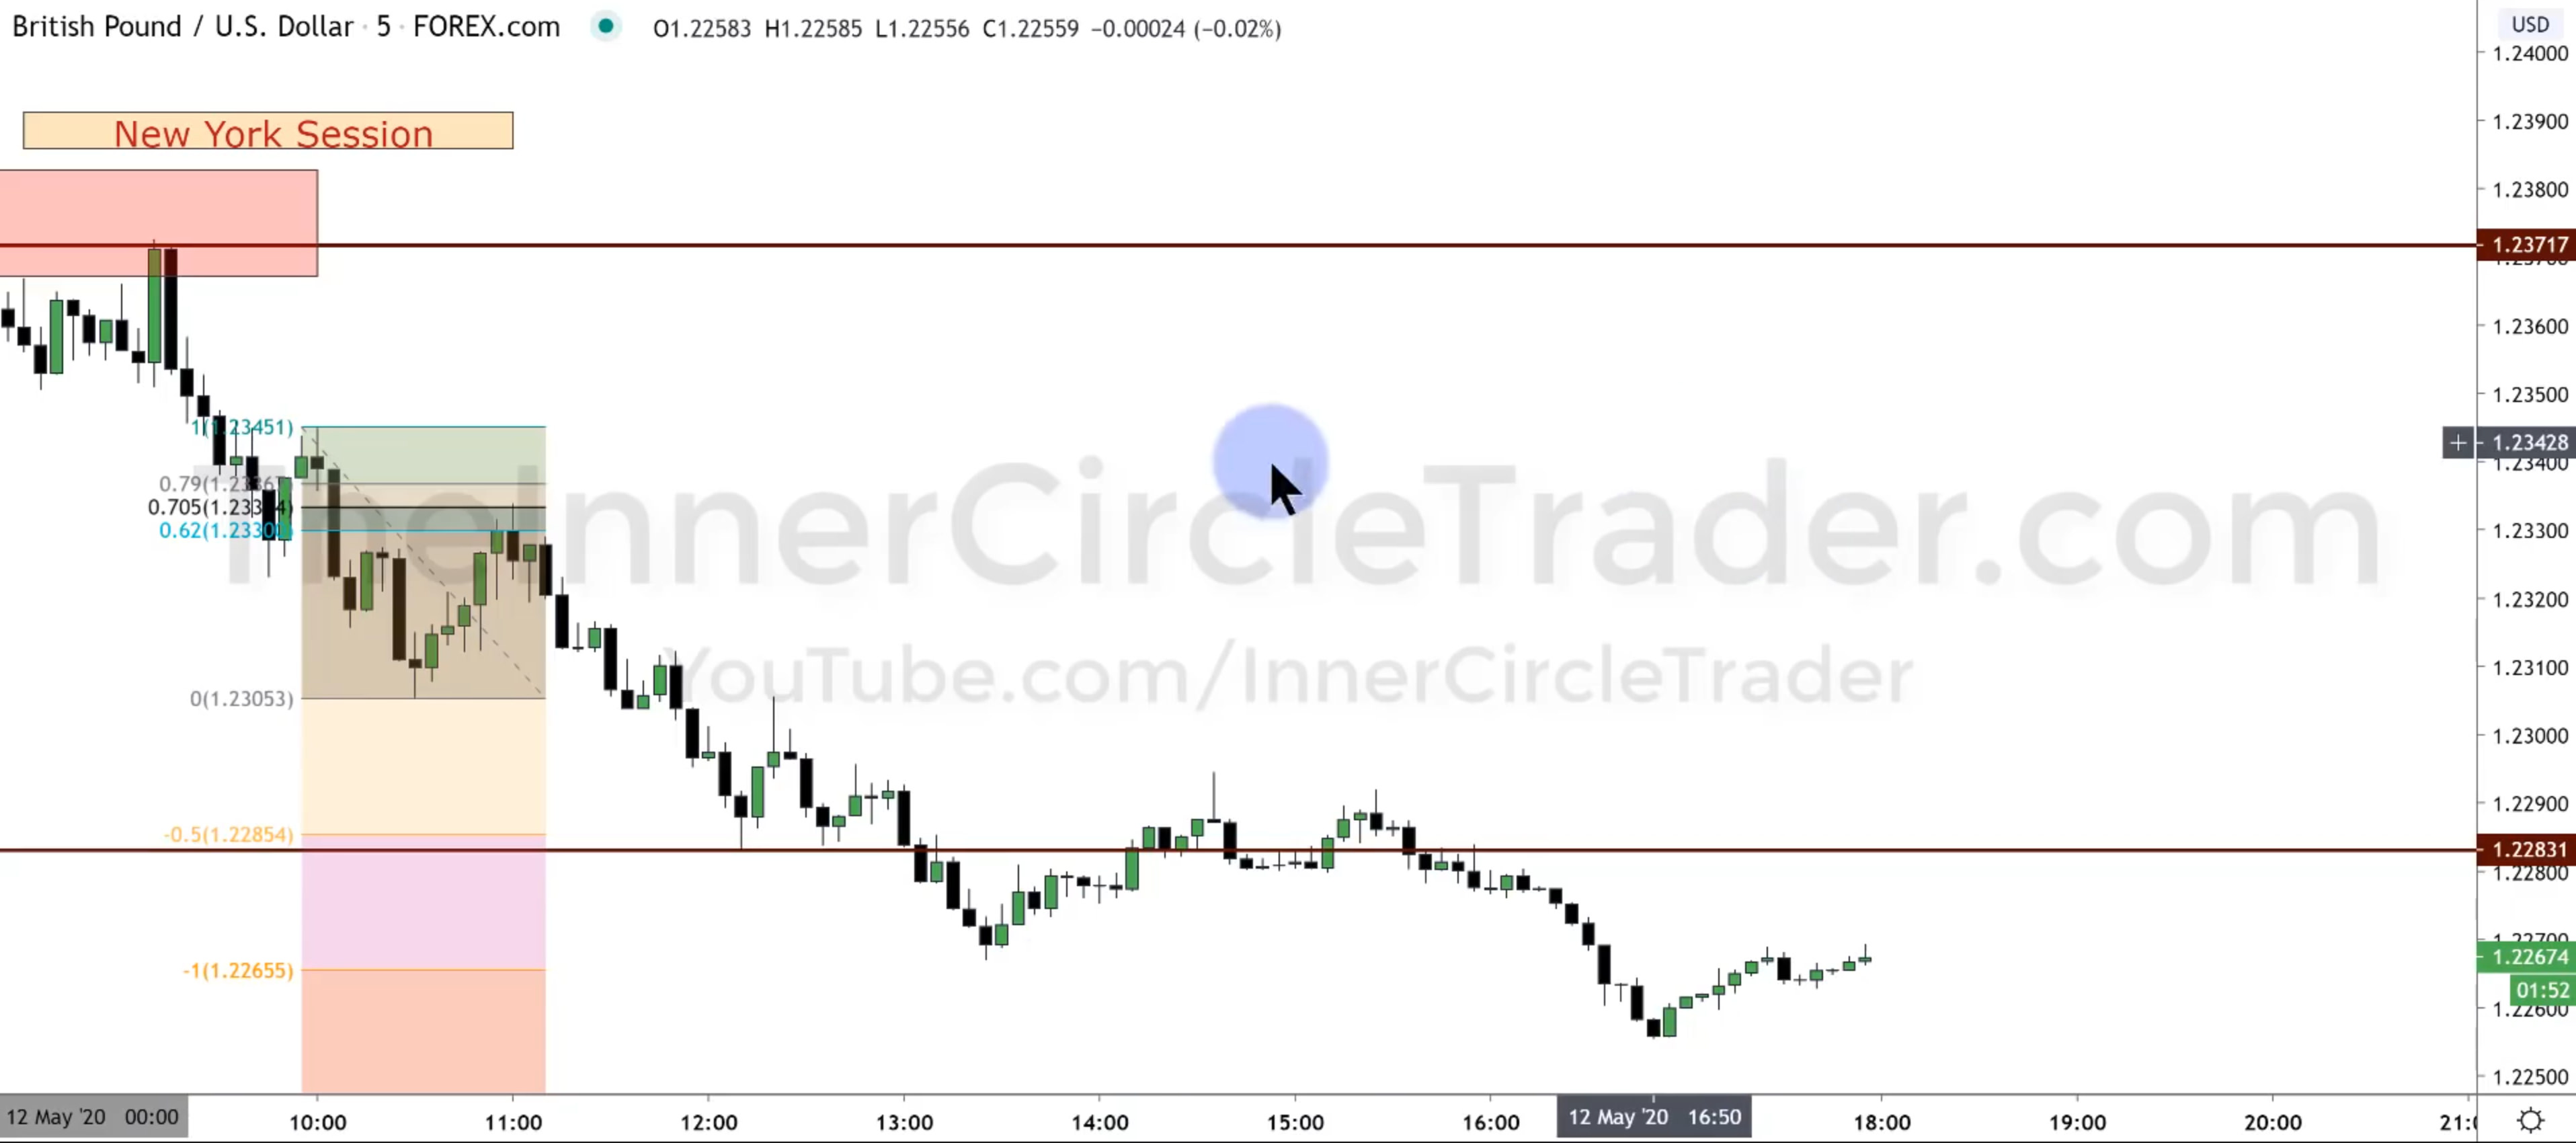
- and here is the OTE Fib marked.
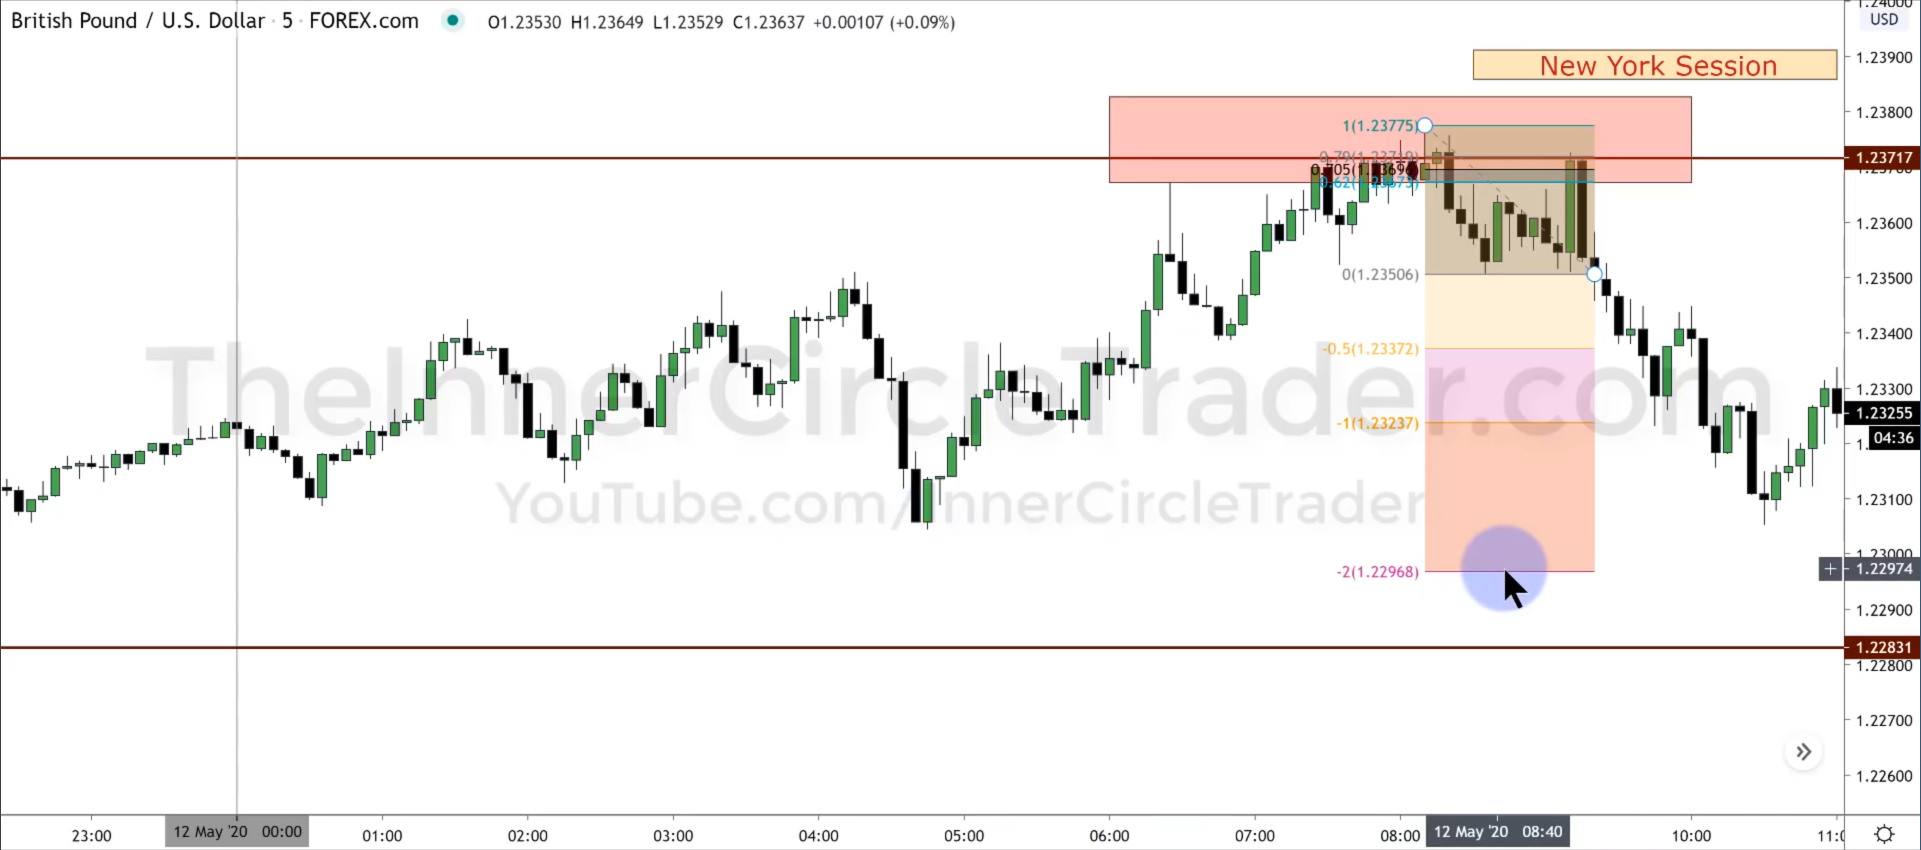
stops will be above the 1.0 point
We see the high, down to the low, and then the price returning to the OTE where we can fill our order. Our -2 level is the 1.23 big level and the institutions reaching for the old lows and the liquidity that can be found there.
- Also note, that we have not yet taken our previous days lows, so there is a second possible OTE entry. The price starts to retrace at at 11am - which is just outside of our session window, but still acceptable. So, place the fib and see if this retracement suggests a trade
- Fib placed
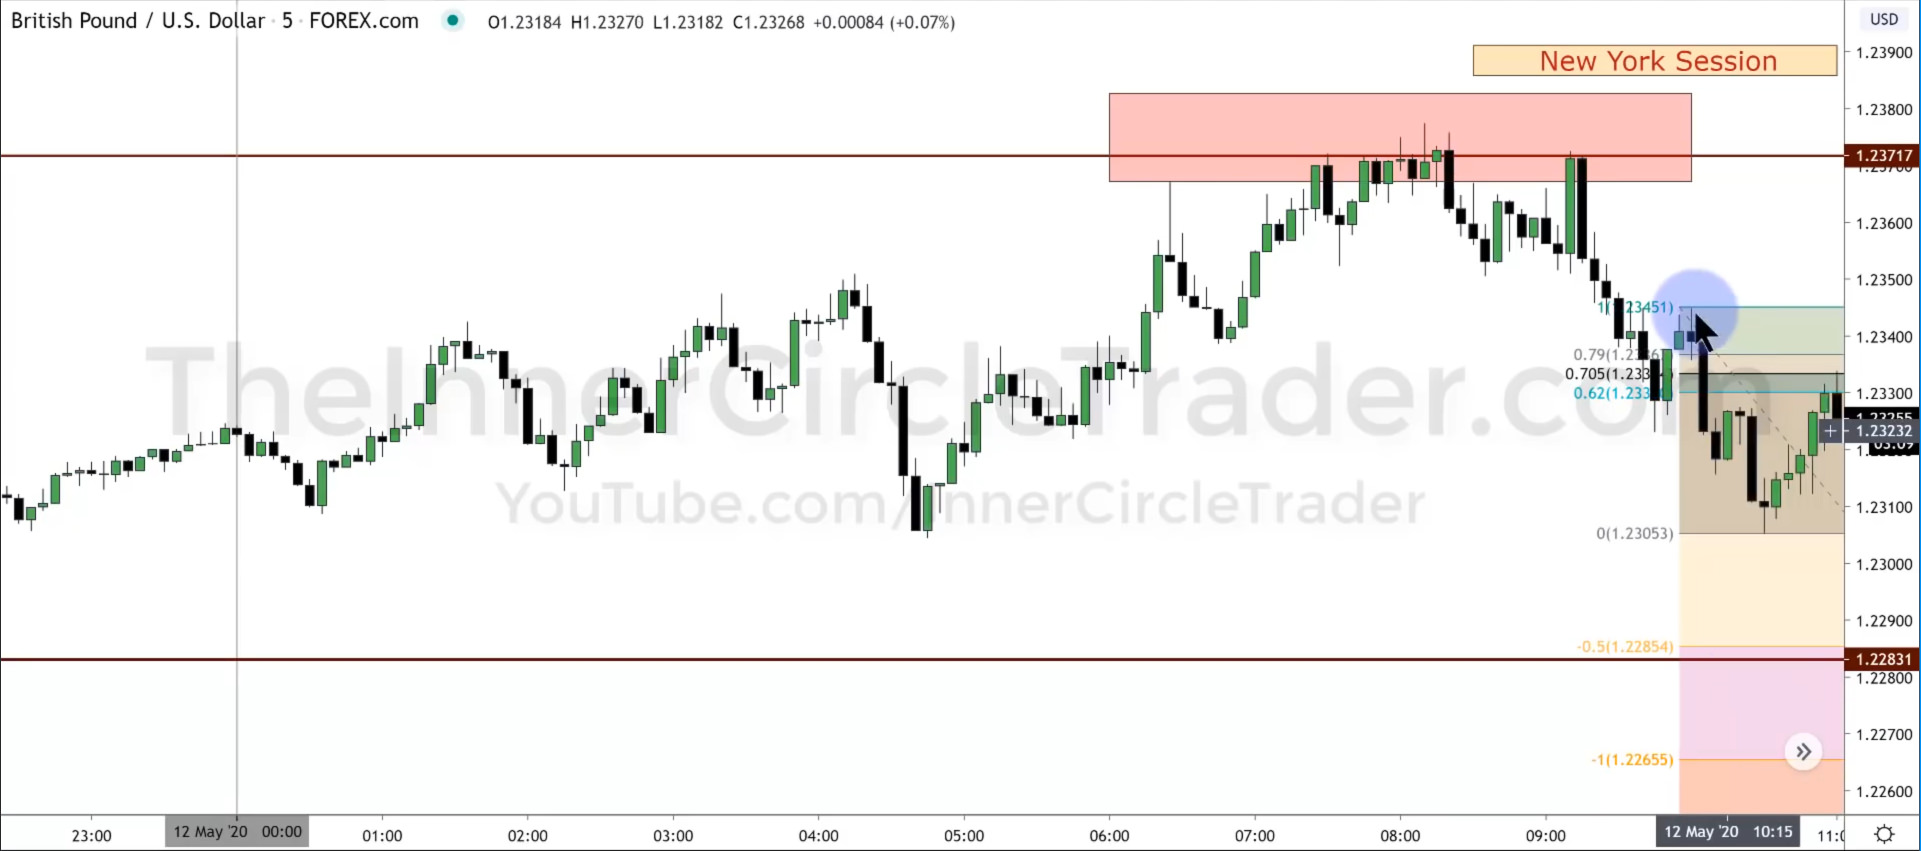
We see the high, low, the retracement into the 62 OTE region and we'll be targeting the previous days low with a short. The stop would be above the high
Our targets:
- 1.2282 - 1.2283 for our 0.5 level
- 1.2265 for our 1.0 level, or we could target the 1.227 level as a more likely target rather than getting a full fib.
We're rounding down our numbers and being content with not being too greedy so we don't make a winning trade a losing one.
- Results:
0.5 taken. 1.0 taken.
[top]
Example 5
- example
[top]
Example 6
- example
[top]
Example 7
- example
[top]
Example 8
- example
[top]
Example 9
- example
[top]
Example 10
- example
[top]
Example 11
- example
[top]
Example 12
- example
[top]
Example 13
- example
[top]
Example 14
- example
[top]
Example 15
- example
[top]
Example 16
- example
[top]
Example 17
- example
[top]
Example 18
- example
[top]
Example 19
- example
[top]
Example 20
- example