
ICT Mentorship 2023 Gems
- 1:30 Judas
- 3PM Judas Swing
- New Week Opening Gap (NWOG)
- Understanding what multiple touches of NWOG means
- Gaps that don't fill are rocket fuel
- Understanding equilibrium of discount
- Understanding low probability conditions
- New Day Opening Gap (NDOG)
- Quarter of the wick
- PM session running AM session Buy stops
- Market on close Macro
- 3:15-3:45 Sweet Spot
- The Upper Quarter Concept
- Regular Trading Hours (RTH)
- When to expect Seek and Destroy conditions
- Implied FVG
- When 3 PD Arrays fail your fucked
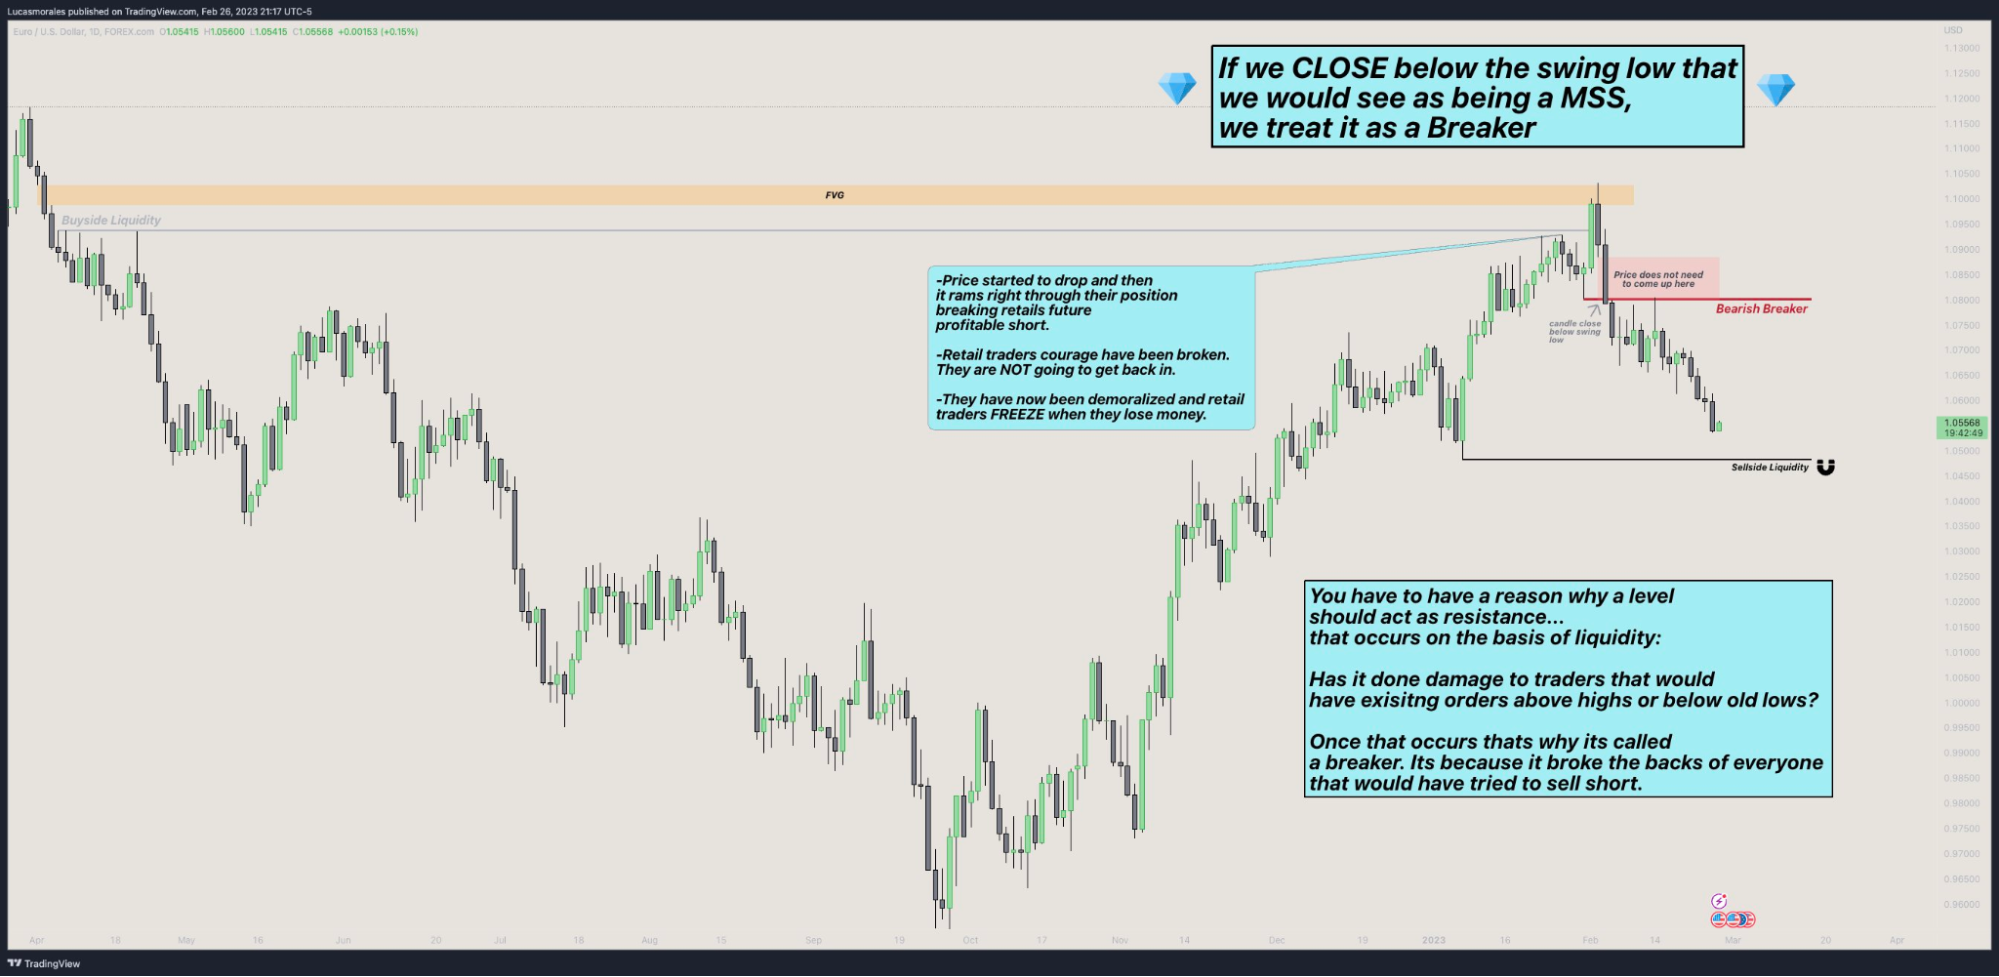
- A CLOSE below the swing low that we would see as being a Market Structure Shift, we treat it as a Breaker
- 3 candle price action signature
- Event Horizon
- How to avoid taking a low probability FVG
- How far can you trust price to go above BSL or SSL for a Turtle Soup?
- NWOG Actual and NWOG
- Macros
- 10-11am Silver Bullet
- MSS after 1pm
- How to use NWOG inside of old areas of orderflow
- Immediate Rebalance
- Using NWOG to analyze market conditions
- Inversion FVG example
- How to approach the lunch hour when bias/target is clear
- Seek and Destroy cheat sheet
- Partials at wicks/long tails
- Understanding Balanced Price Ranges(BPRs)
- More Silver Bullet gems
- ICT Glossary of terms
Summarized by @SirPickle_ as a google document here
1:30 Judas
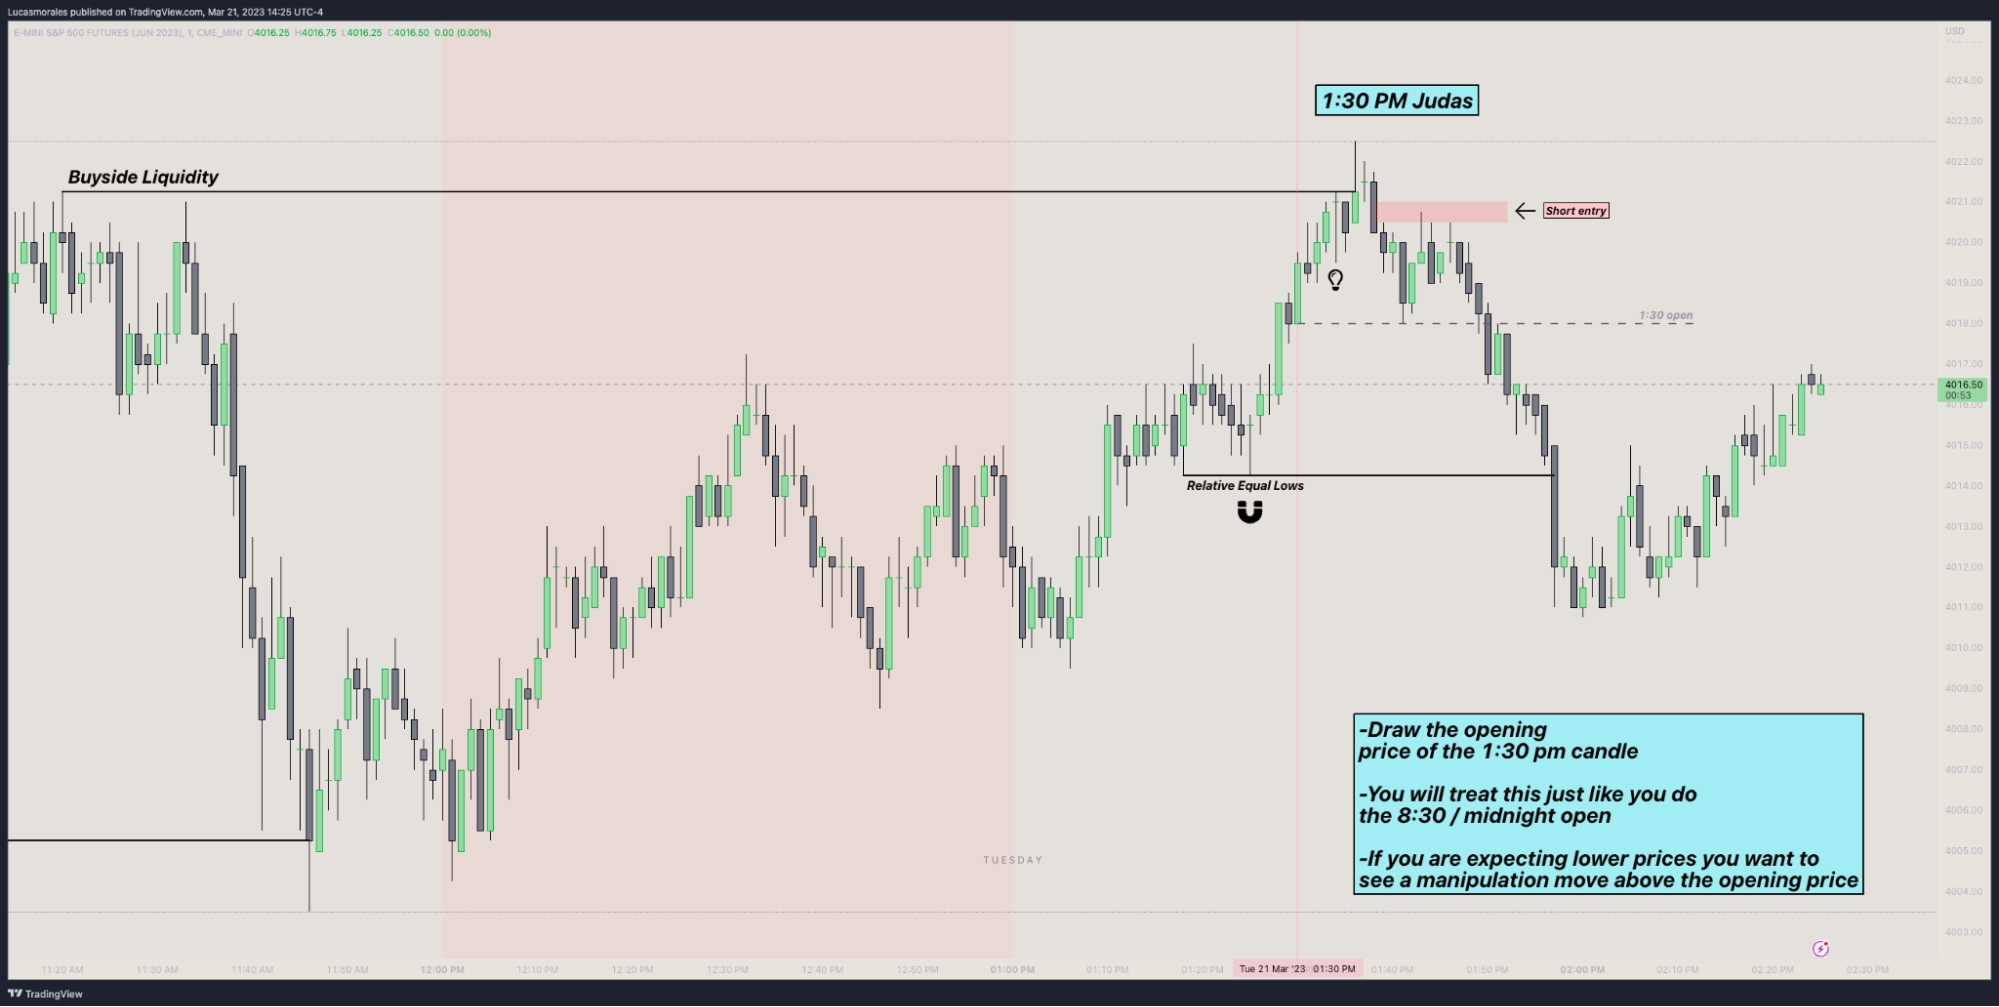
"At the last portion of the day if you are bearish you can use the opening price at 1:30pm and use it the same way the Midnight/8:30 open is used. It's all fractal"
Draw the opening price of the 1:30pm candle. If you are expecting lower prices you want to see a manipulation move above the opening price.
Example 1
ES 1m
Example 2
ES 1m
- AM session buy stops ran
- RELs are the draw
- MSS + Displacement
- Short entry in the FVG
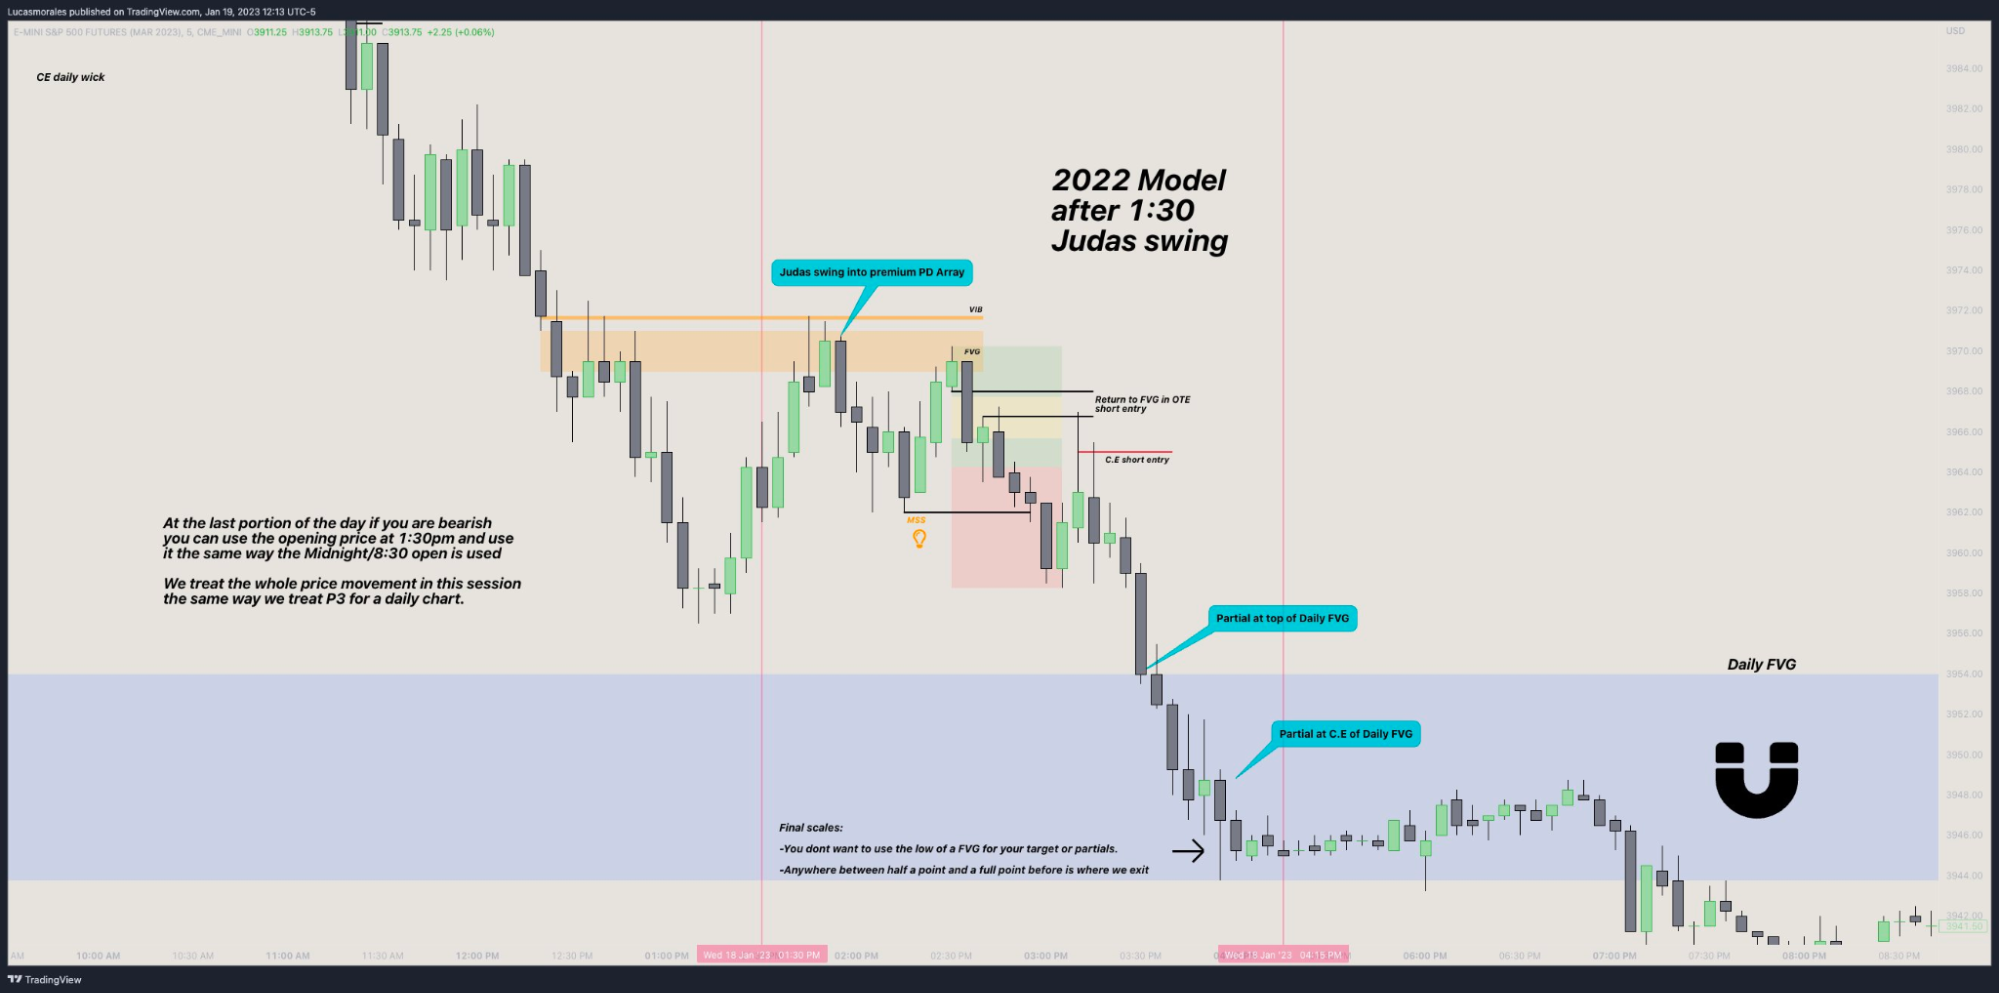
Example 3
ES 1m
- High of day (HOD) Buy-side was swept and had a MSS + Displacement
- We look for a Judas Swing at 1:30pm into a premium PD Array
- Today that PD Array was a 1min FVG
- Could not get fill in the FVG so entry on the VIB
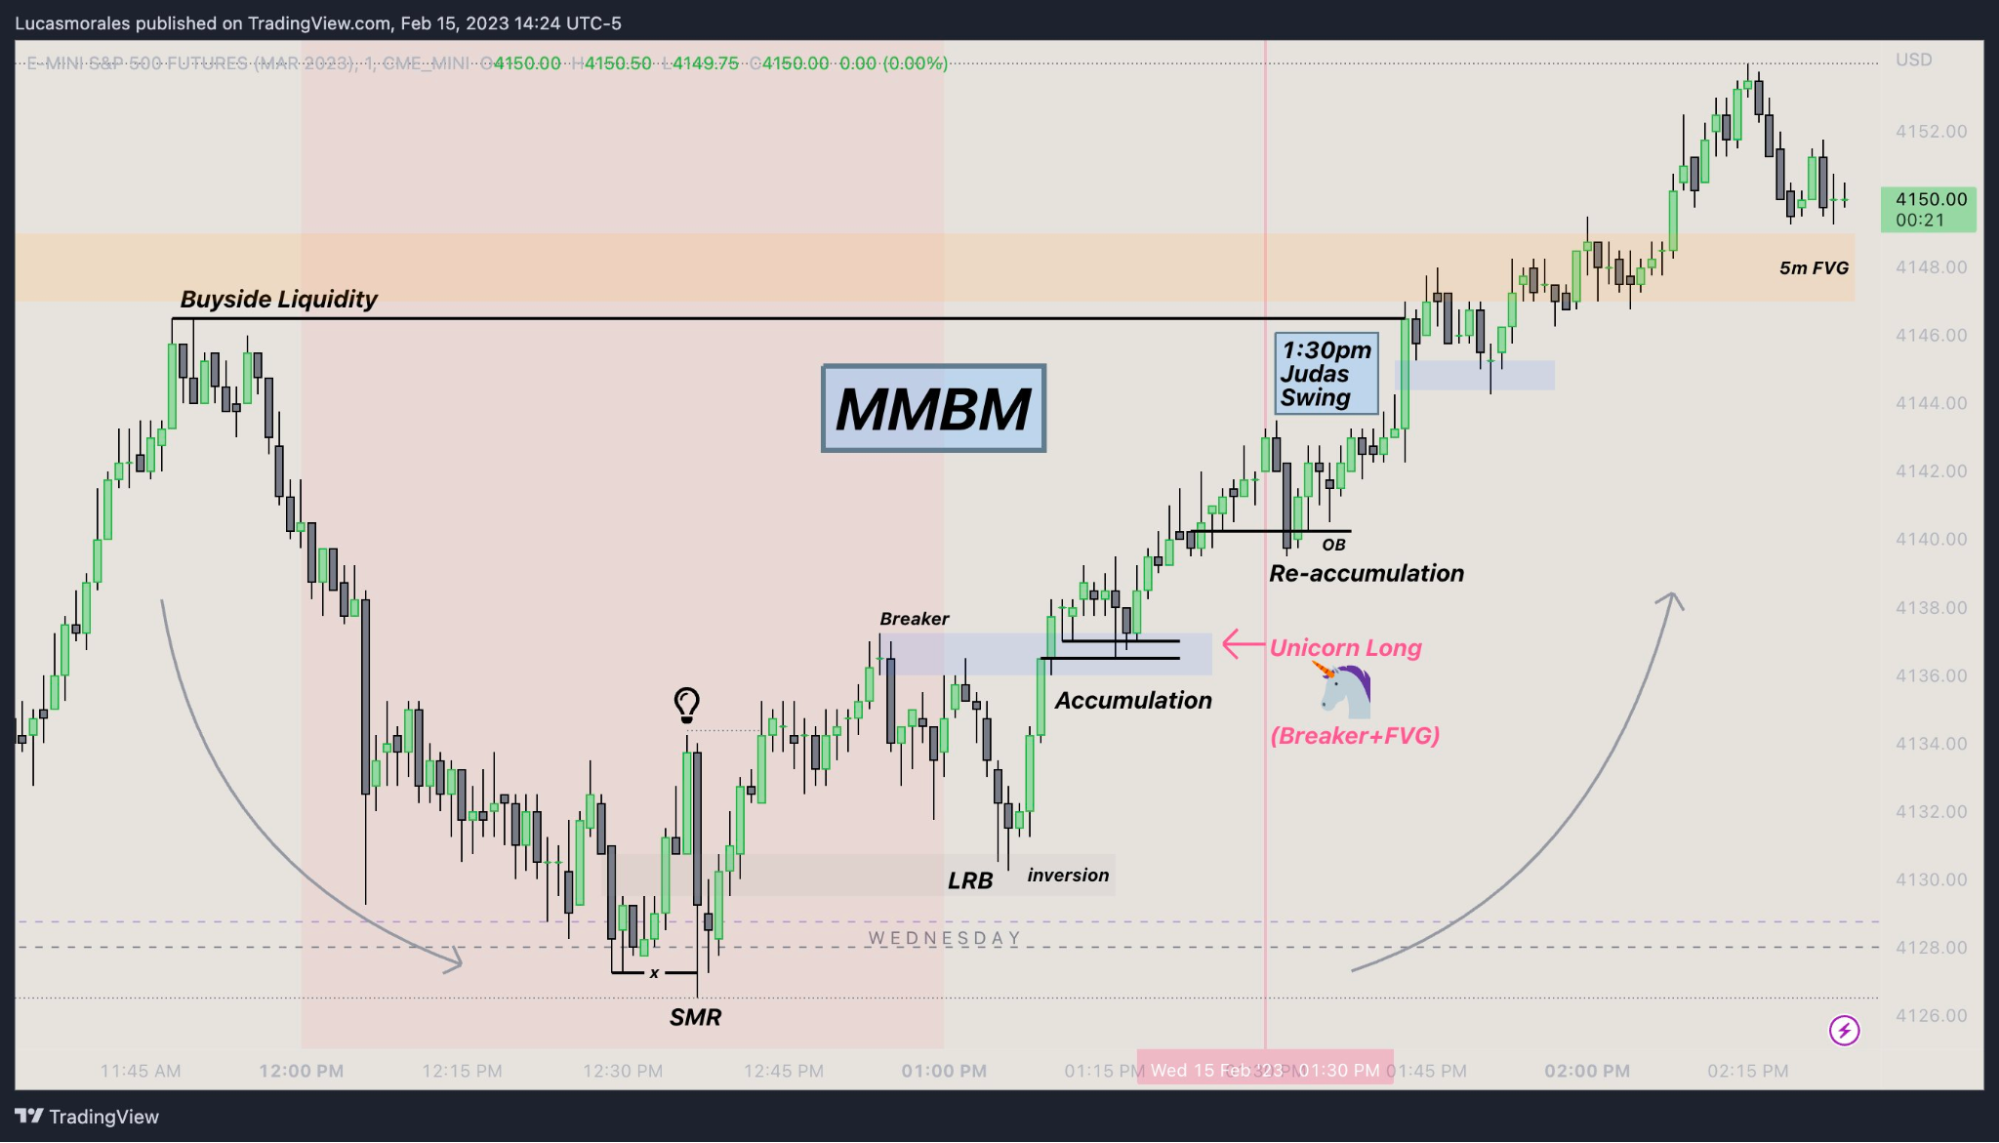
Example 4
ES 1m
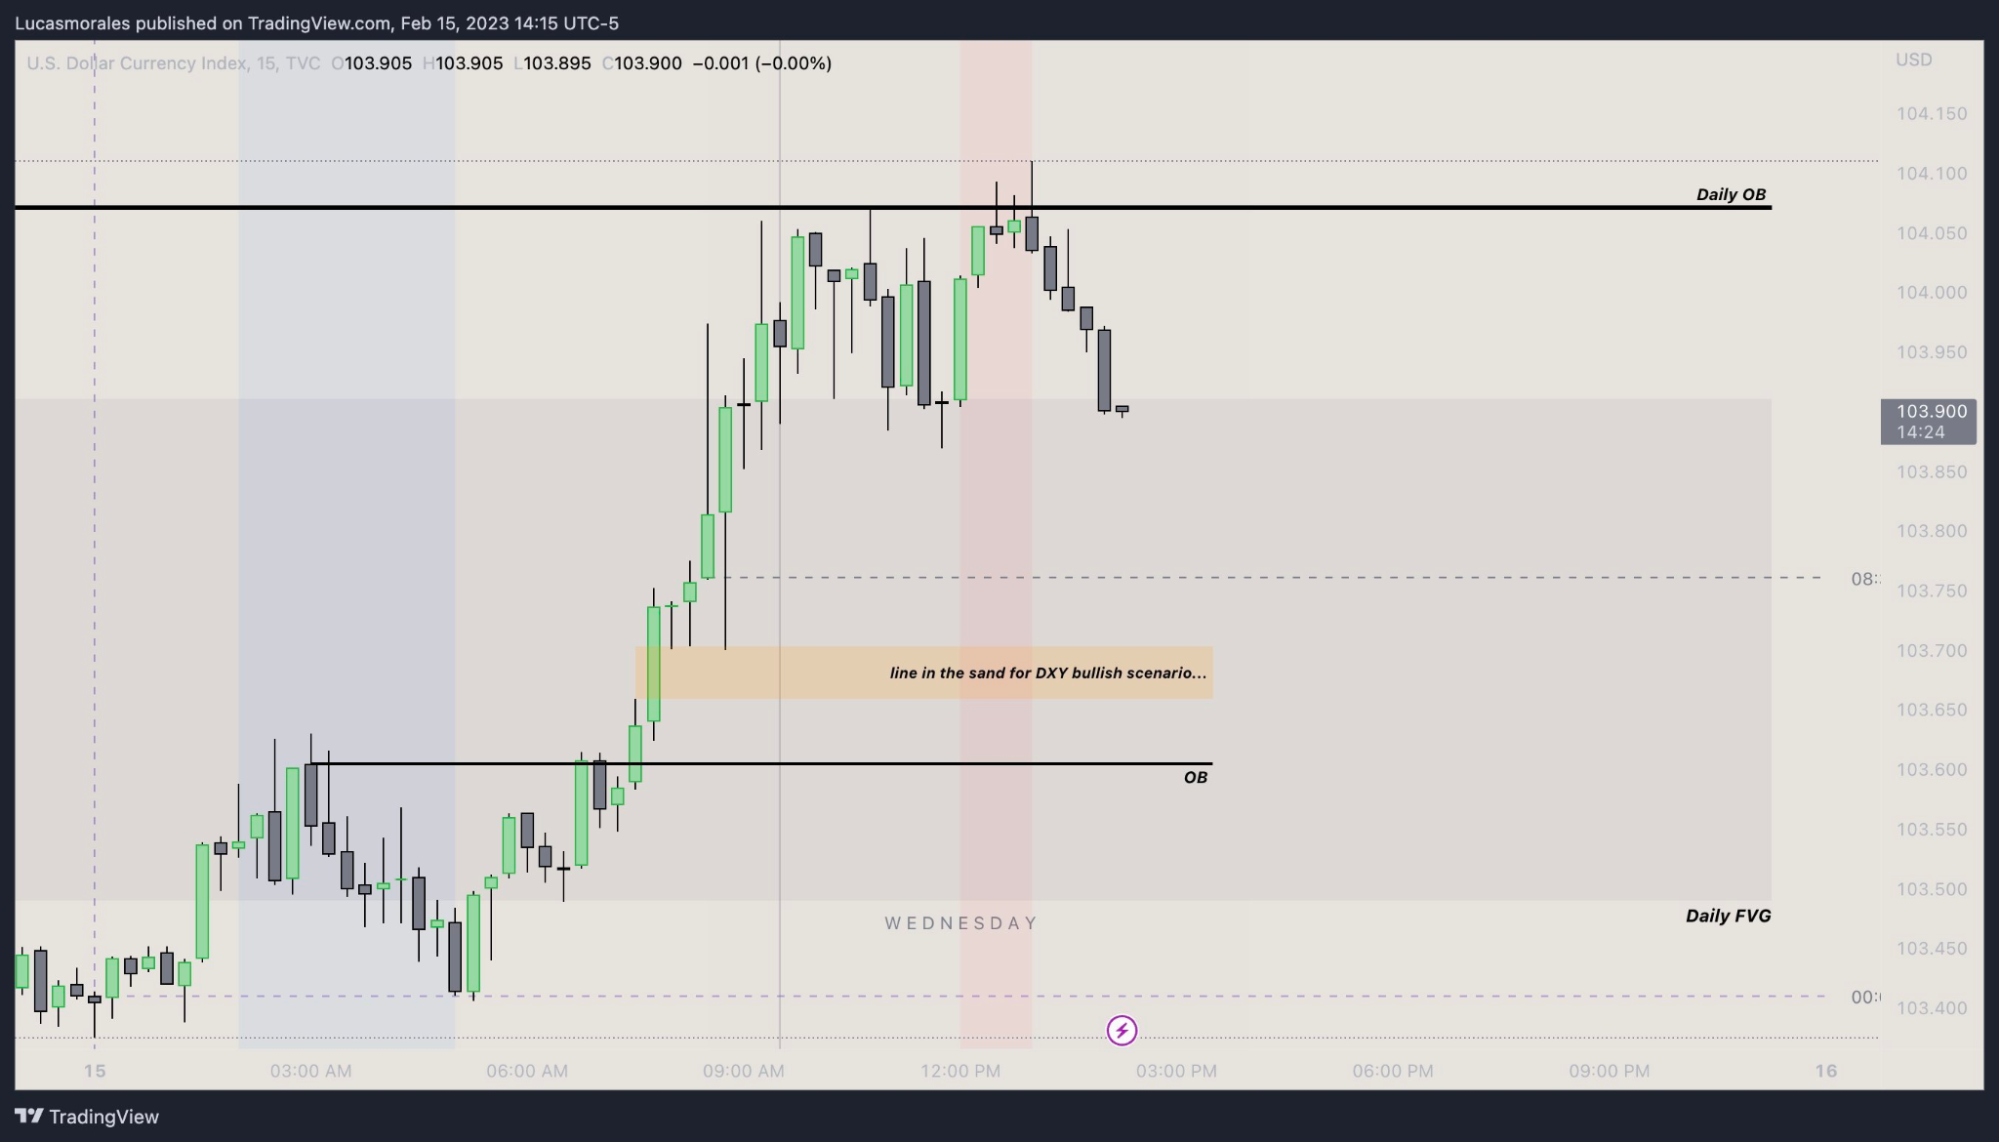
- Lunch SSL swept and we had a MSS+Displacement (2022 model)
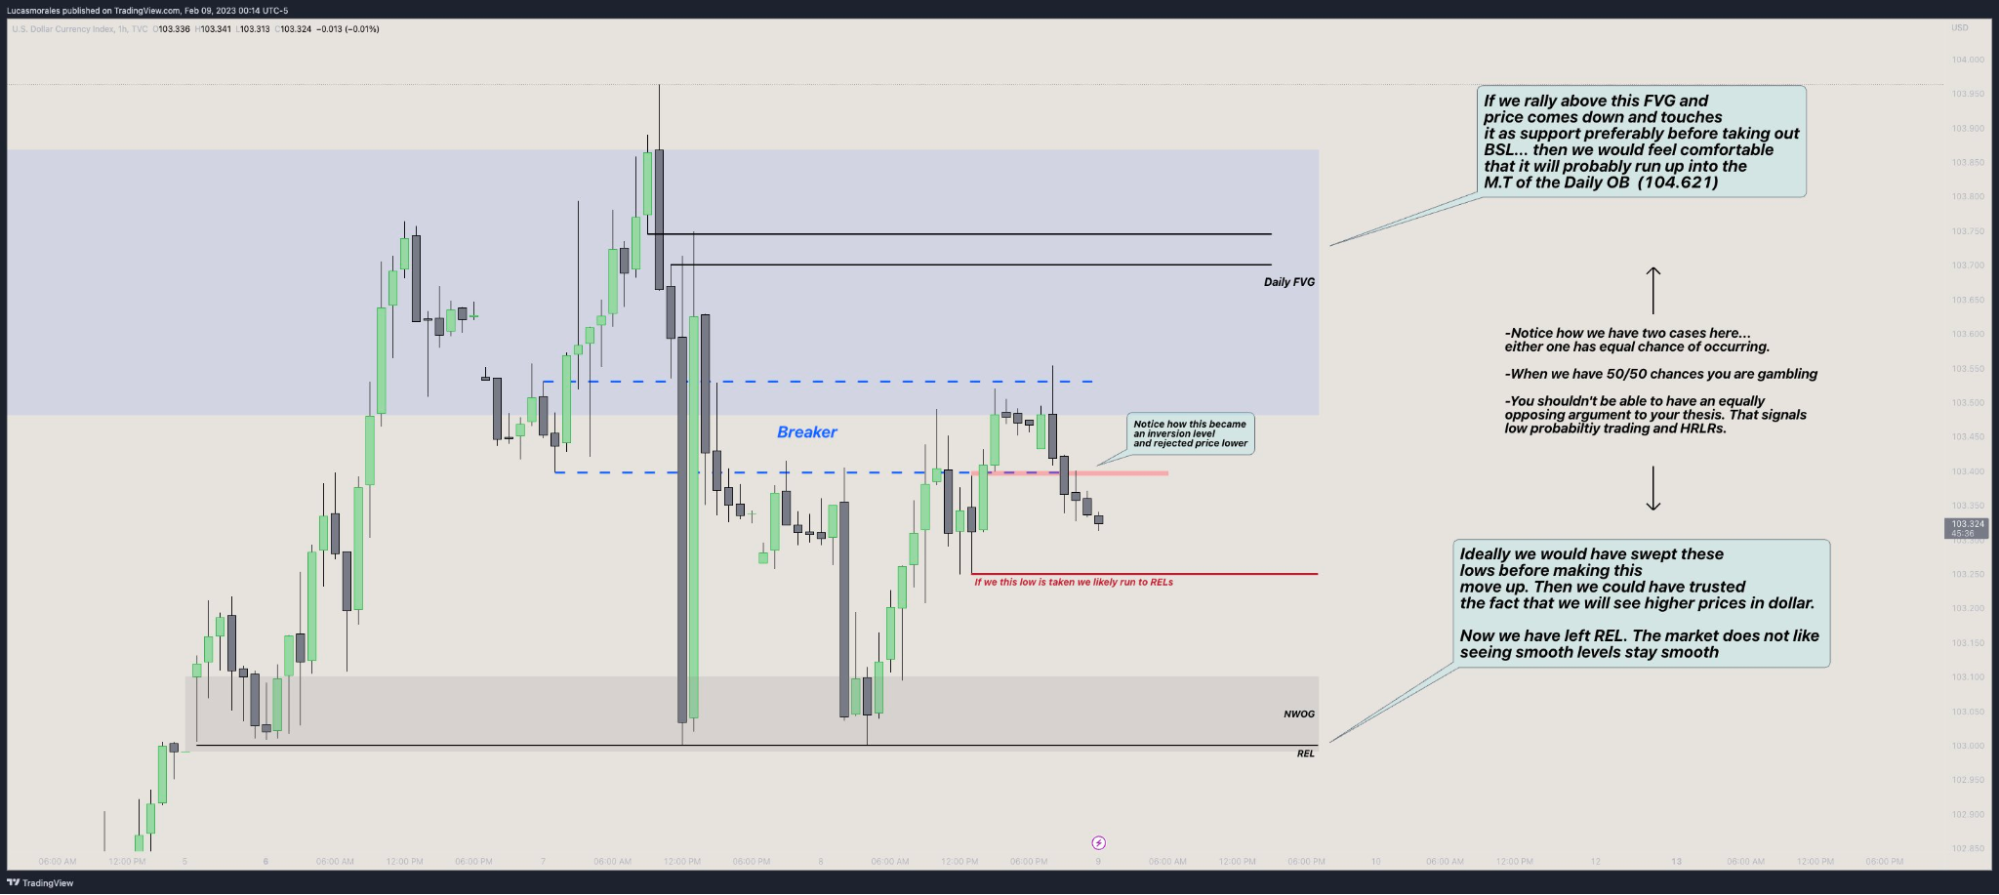
- DXY rejecting Daily OB means we should see higher prices in ES
- Unicorn setup provided entry at accumulation phase
- We look for Judas Swing at 1:30pm into a discount PD array (+OB offered entry at re-accumulation phase of the MMBM)
DXY 15m
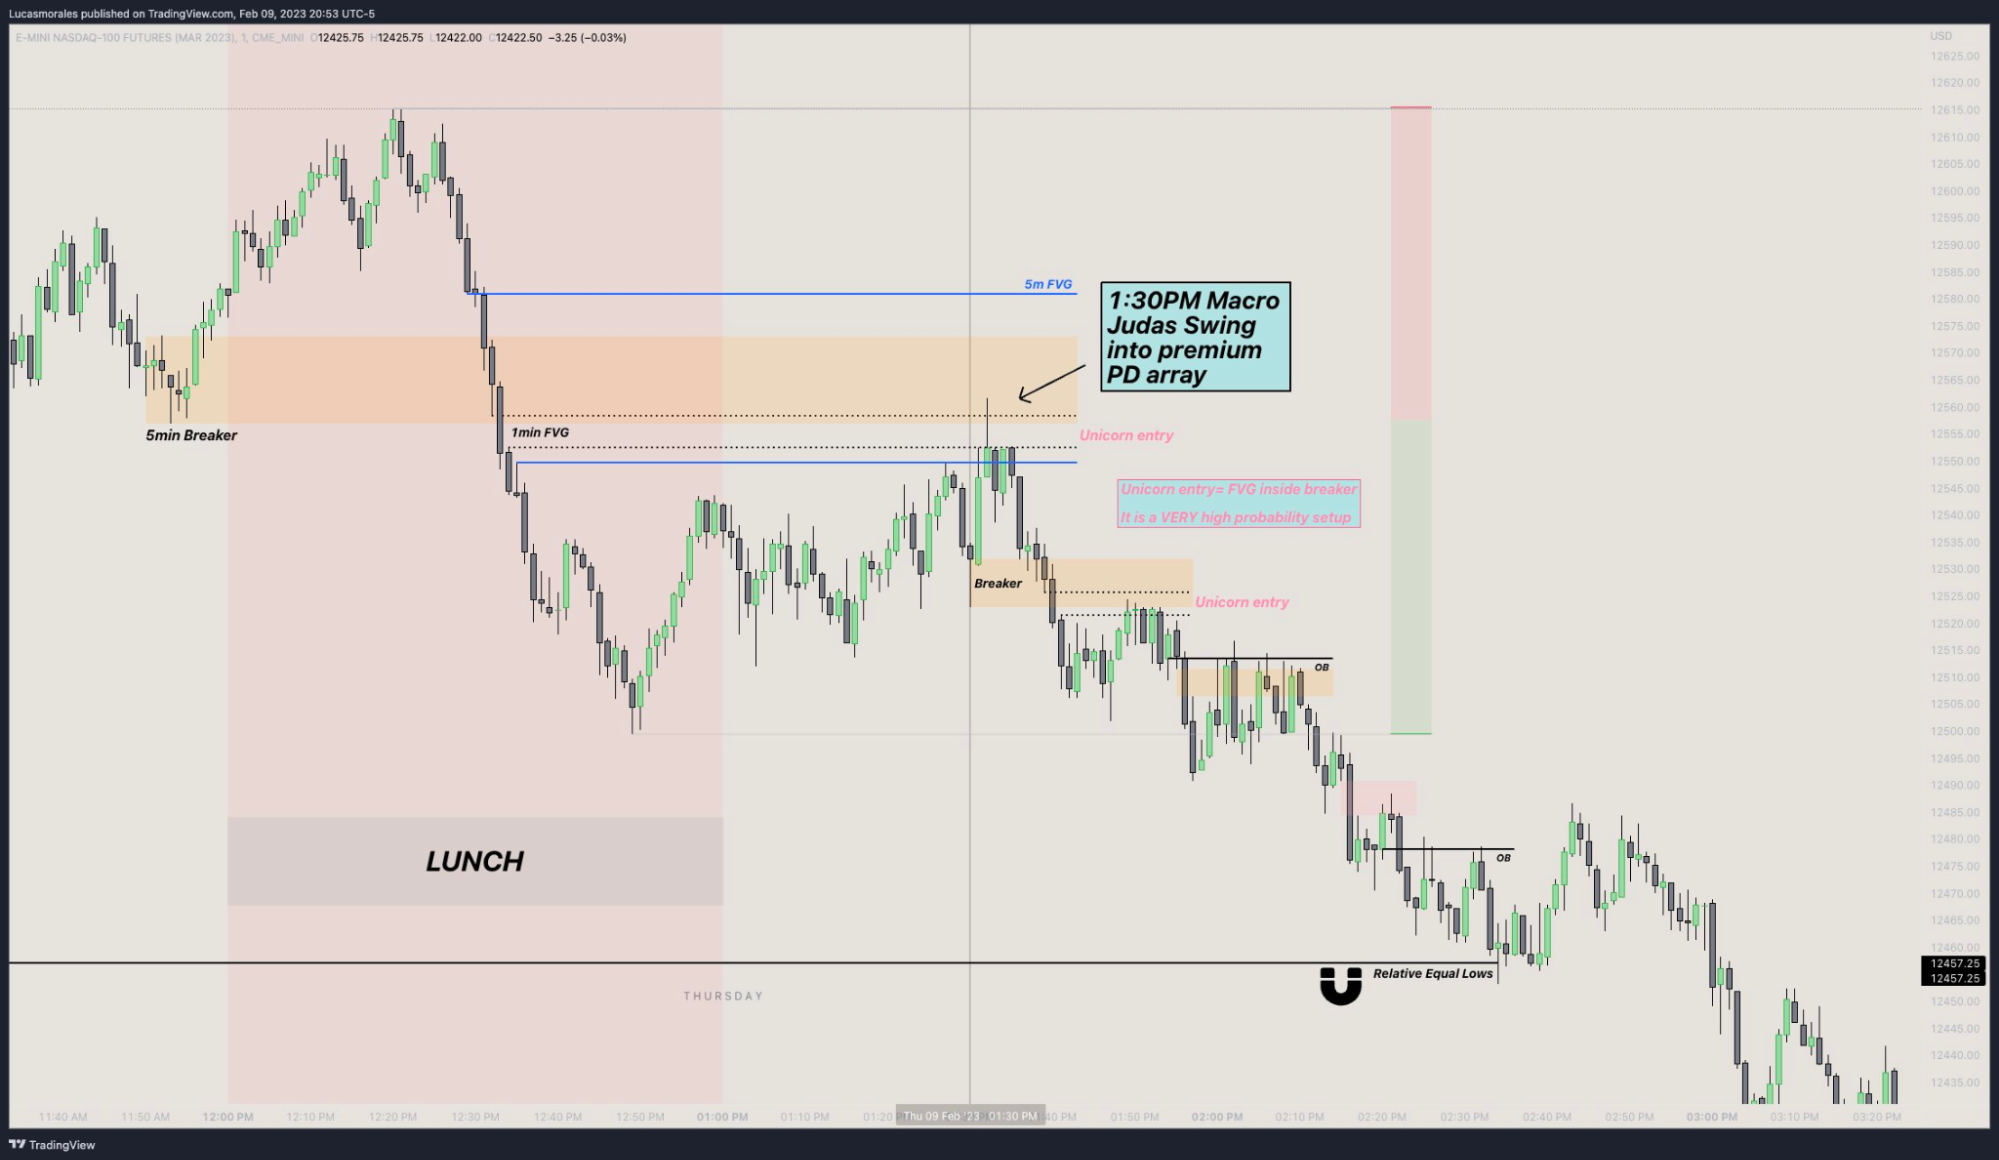
Example 5
NQ 5m
- With the idea that price is drawing towards REL (12457.25), we look for a Judas Swing at 1:30pm into a premium PD array.
- Today that PD array was a 5m unicorn (Breaker+ FVG)
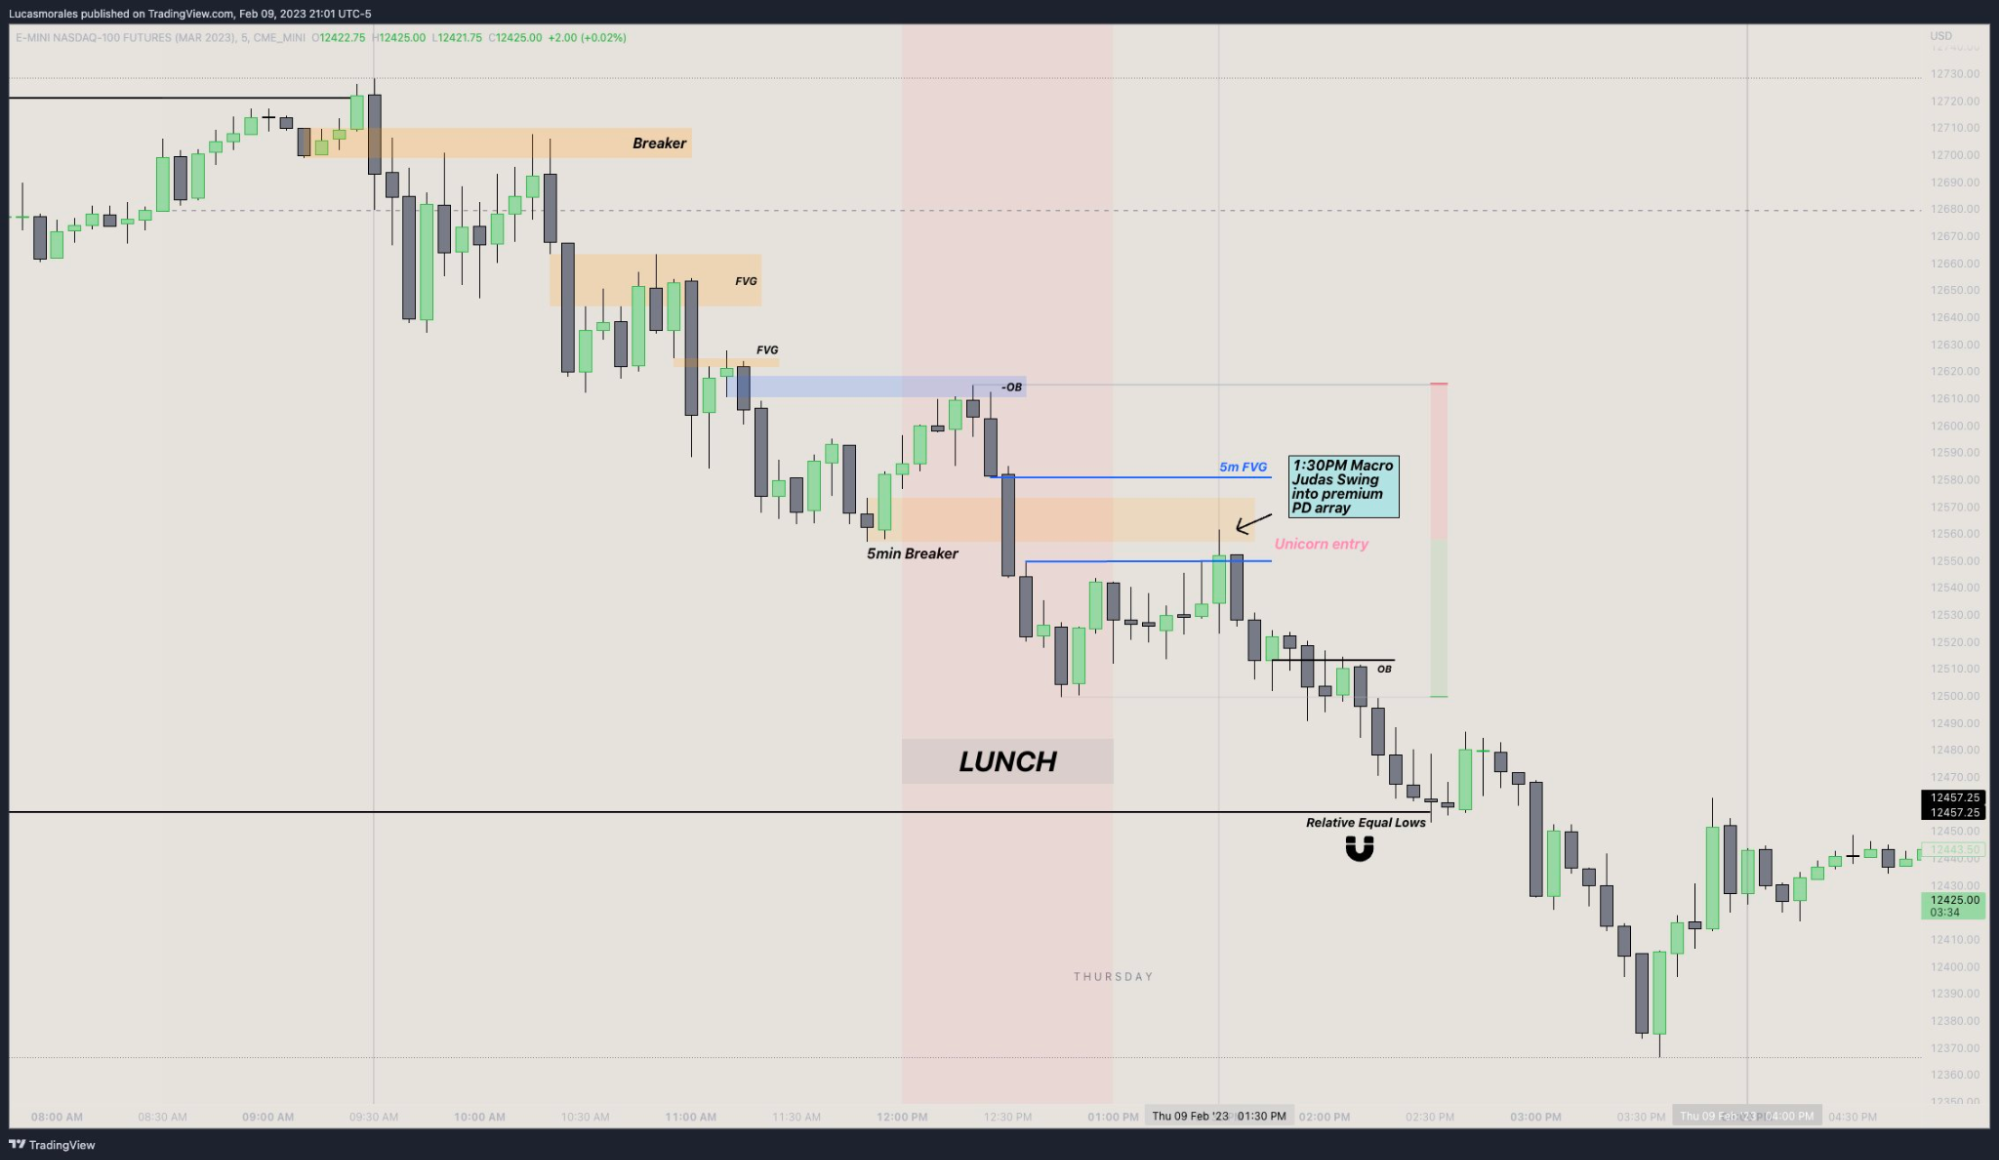
NQ 1m
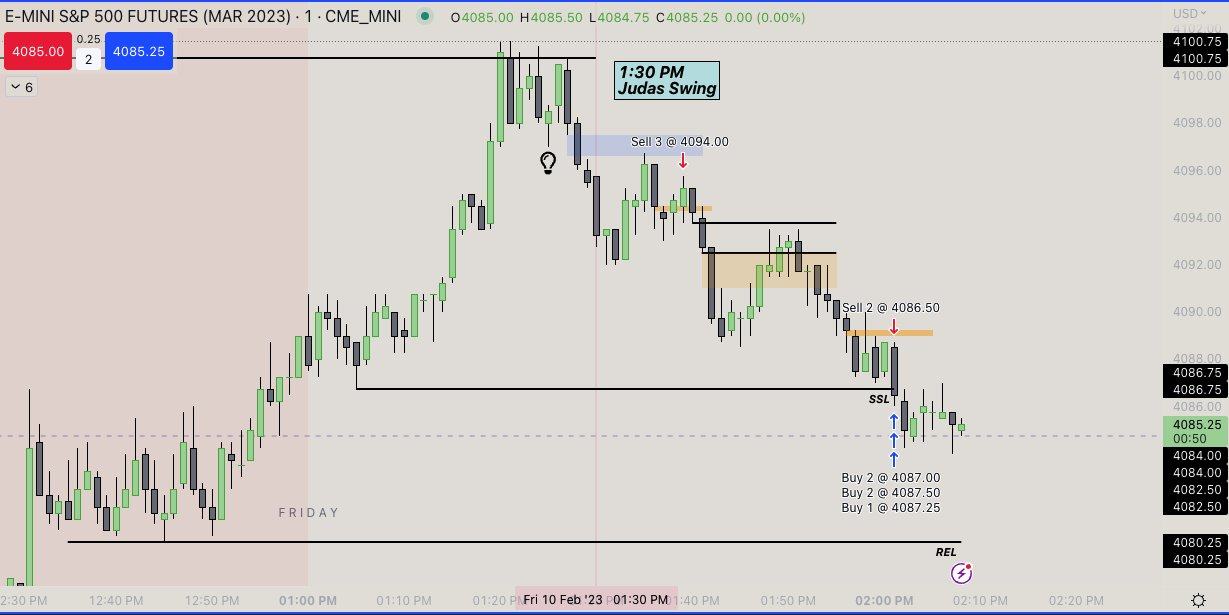
Example 6
ES 2m
- Shorts been in control all week = expect short coverings going into the weekend
- We look for a Judas Swing at 1:30pm into a discount PD Array
- Today that PD array was a Unicorn or even the +OB
- Price will now seek Buyside Liquidity
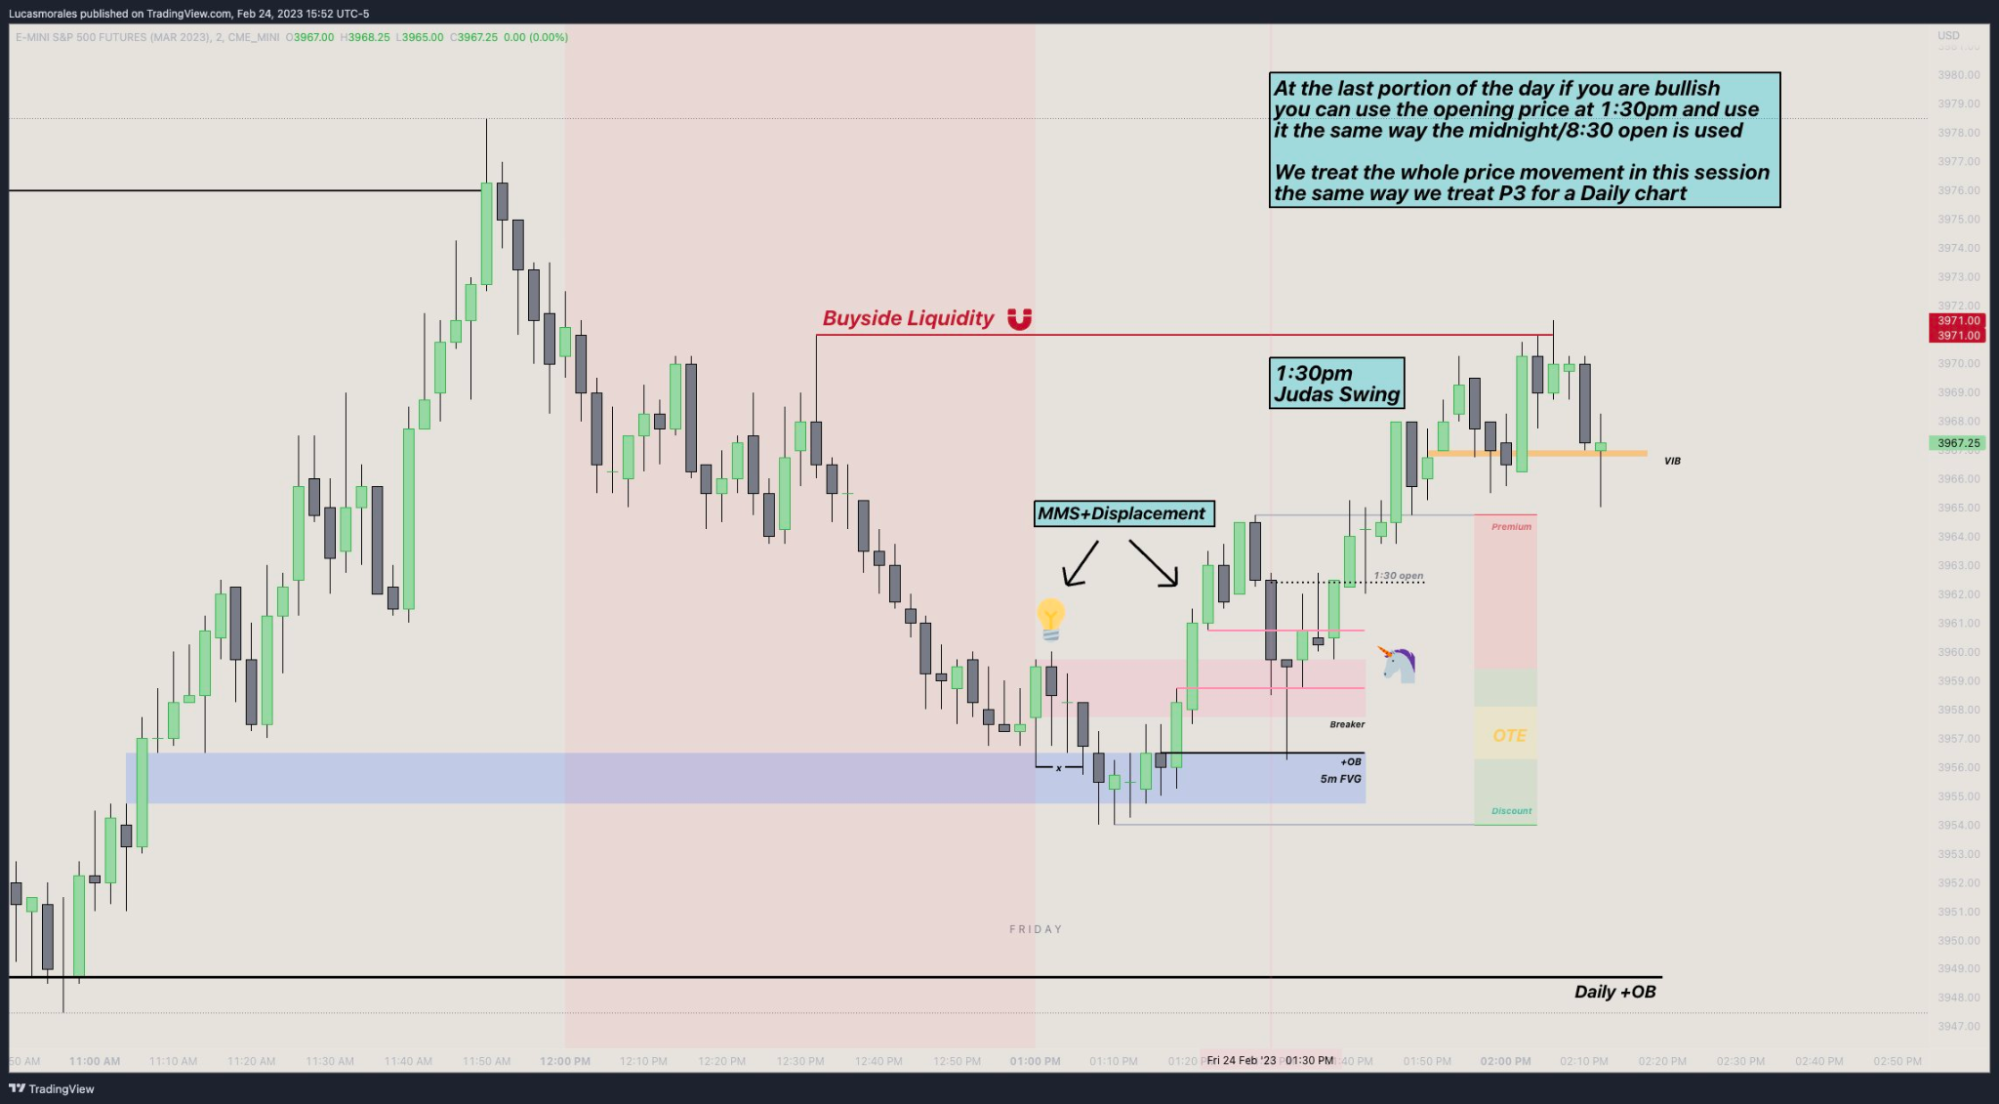
ES 5m

[top]
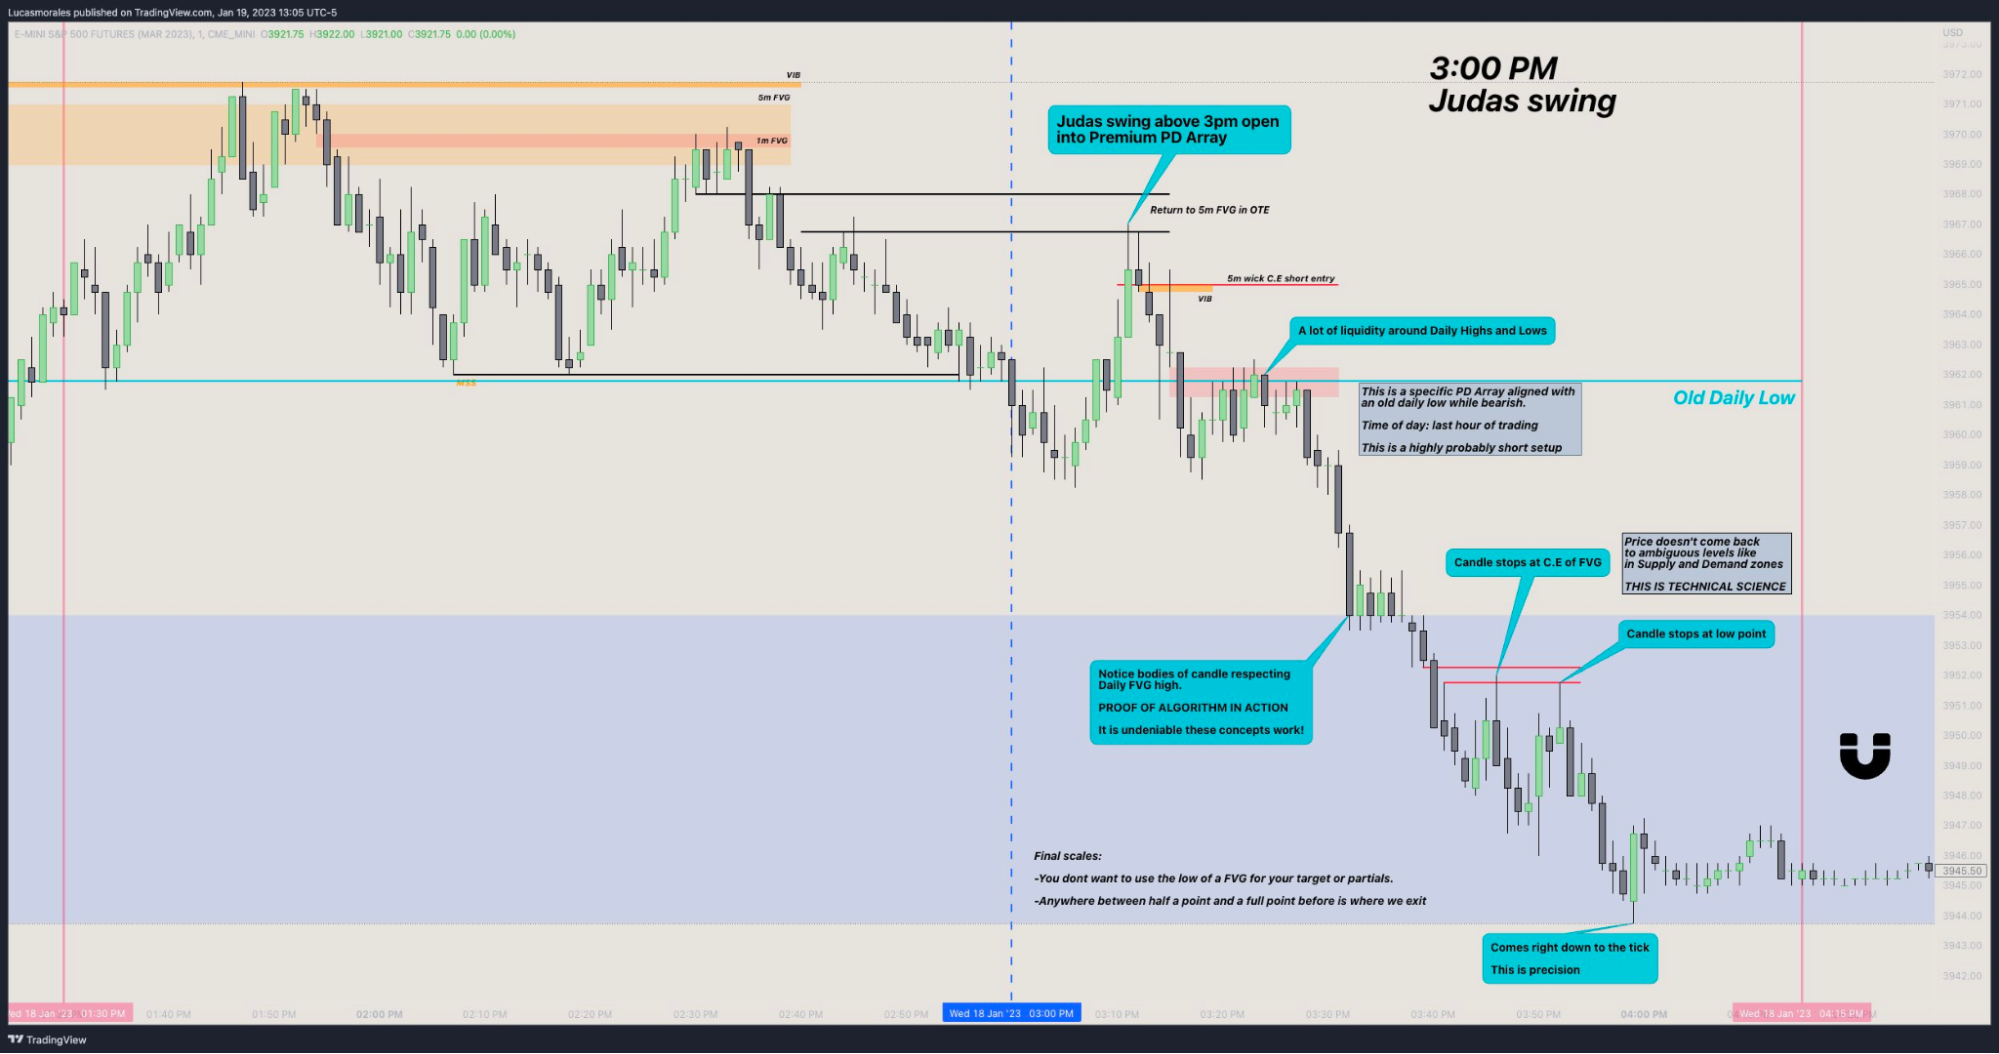
3PM Judas Swing
- The same concept can be applied to the 3pm session as well!
- From my personal experience I don't see this one happen as often or even act as reliable as the 1:30 Judas. For that reason I don't have many examples.
Example
ES1m
[top]
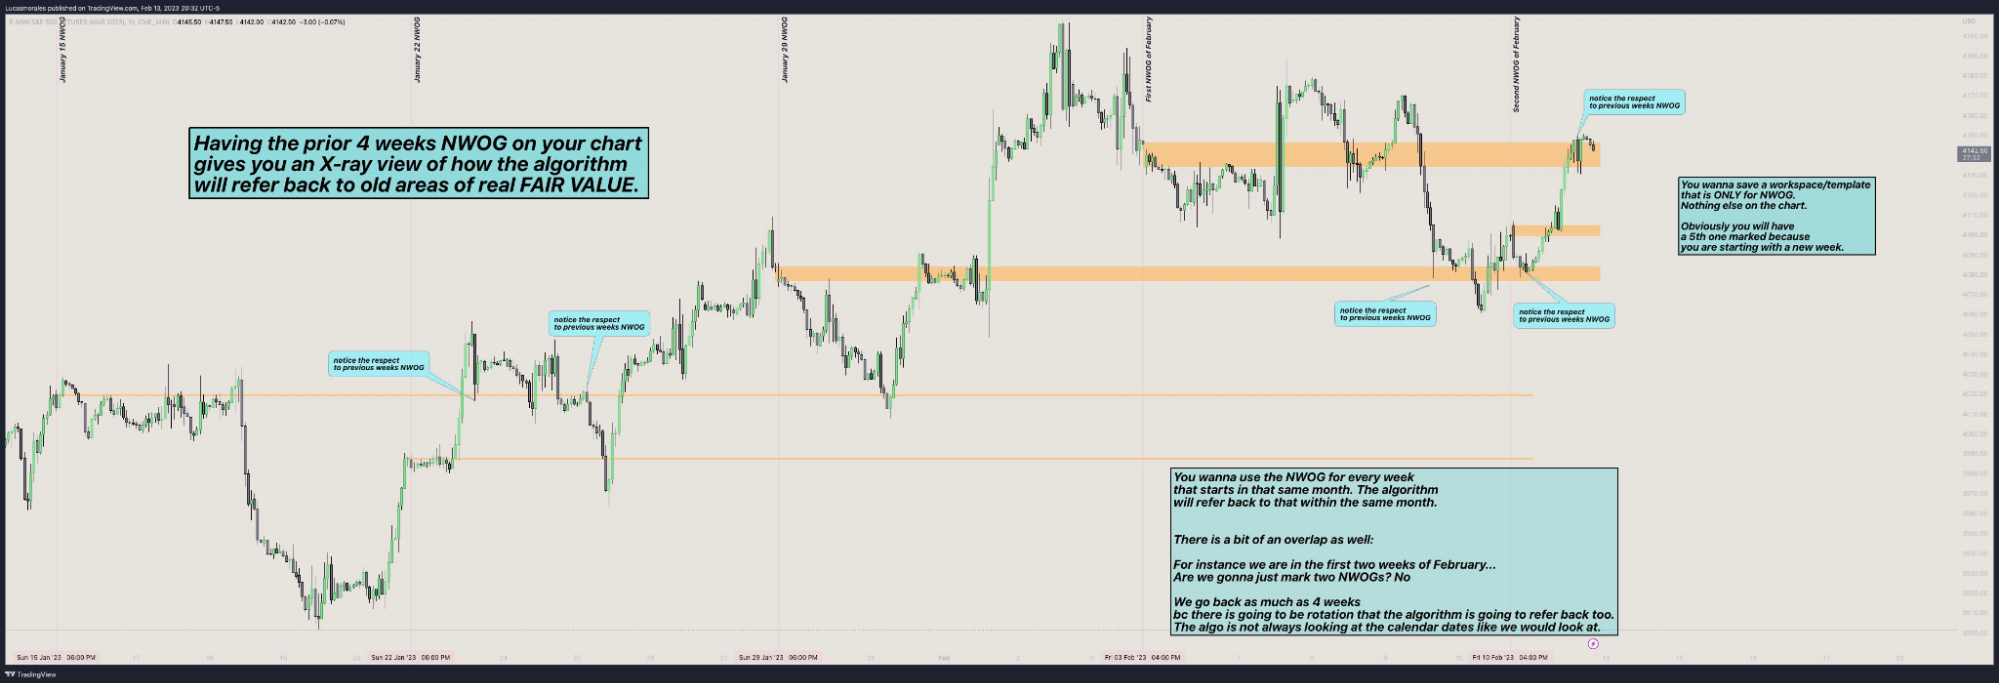
New Week Opening Gap (NWOG)
The New Week Opening Gap is a strong price magnet
Draw it out every week onto your charts (Friday closing price to Sunday open price)
The market is going to gravitate back to it IF we are NOT TRENDING and many times become REAL support/resistance
You should have the last 4 NWOGs + the current week's NWOG on your chart. So 5 in total. Have a separate template for only NWOG.
Doing so gives you an X-ray view of how the algorithm will refer back to old areas of real FAIR VALUE
[top]
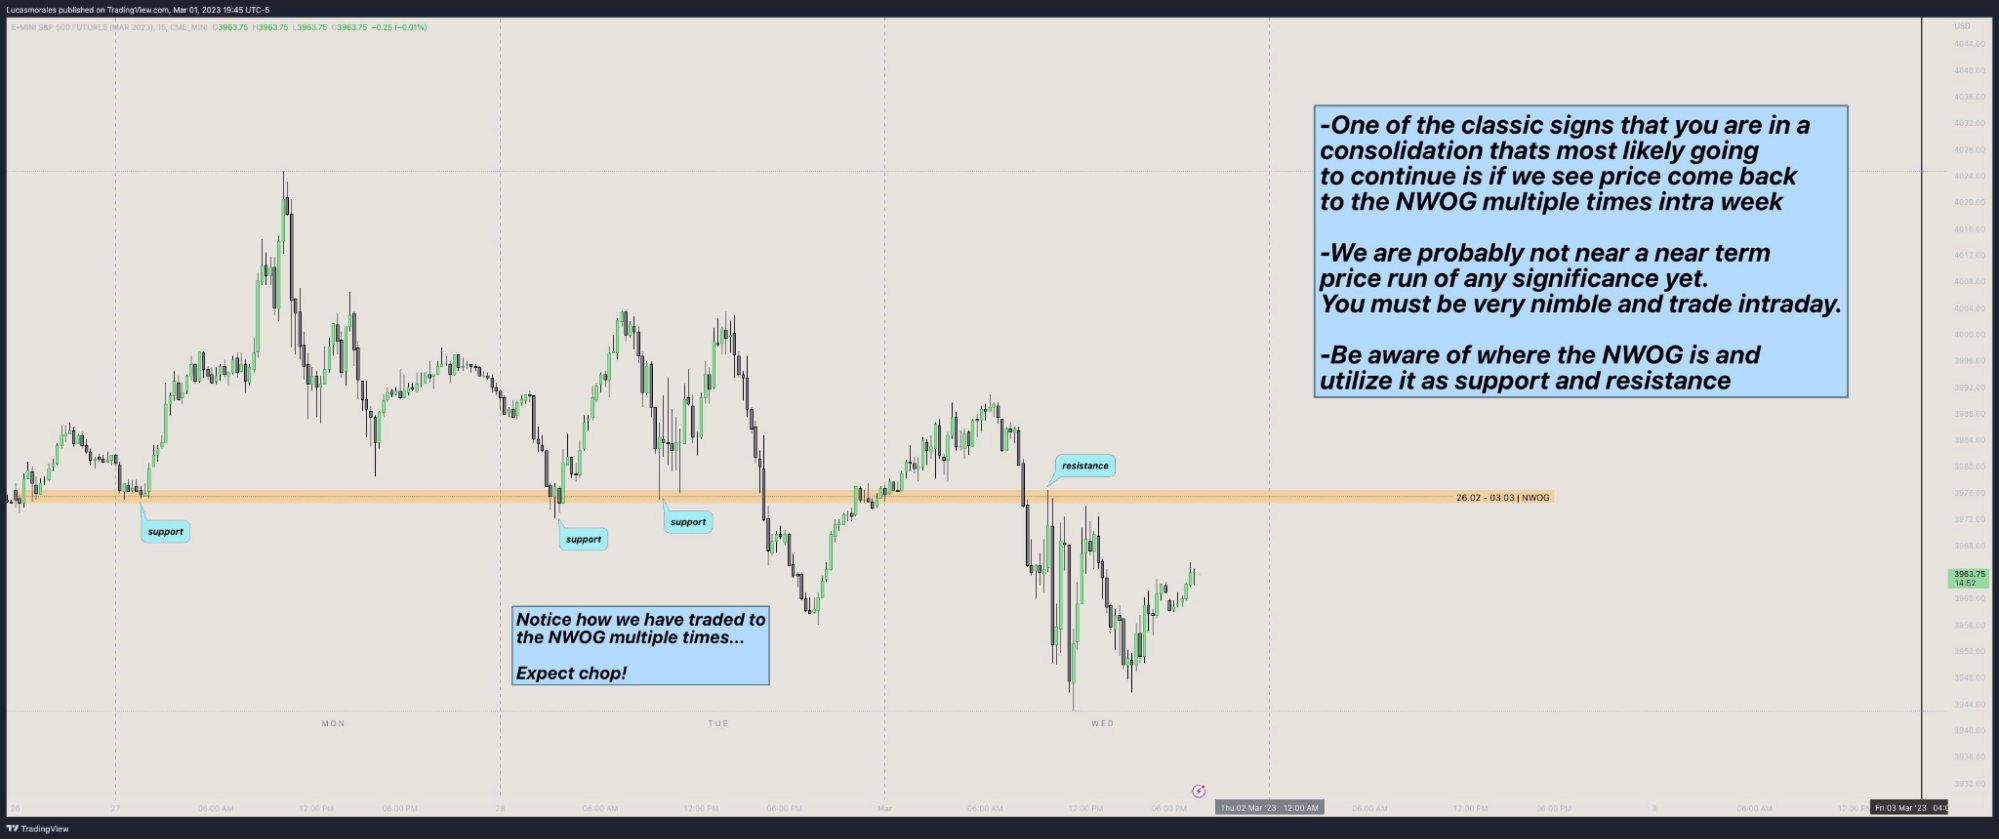
Understanding what multiple touches of NWOG means
If we see price come back to the NWOG multiple times intra week you are likely in a consolidation that's going to continue
[top]
Gaps that don't fill are rocket fuel
This means price is in a hurry to reprice to a level that's outside the range its in currently (External range liquidity)
Every time we get in a trade we look for this signature
[top]
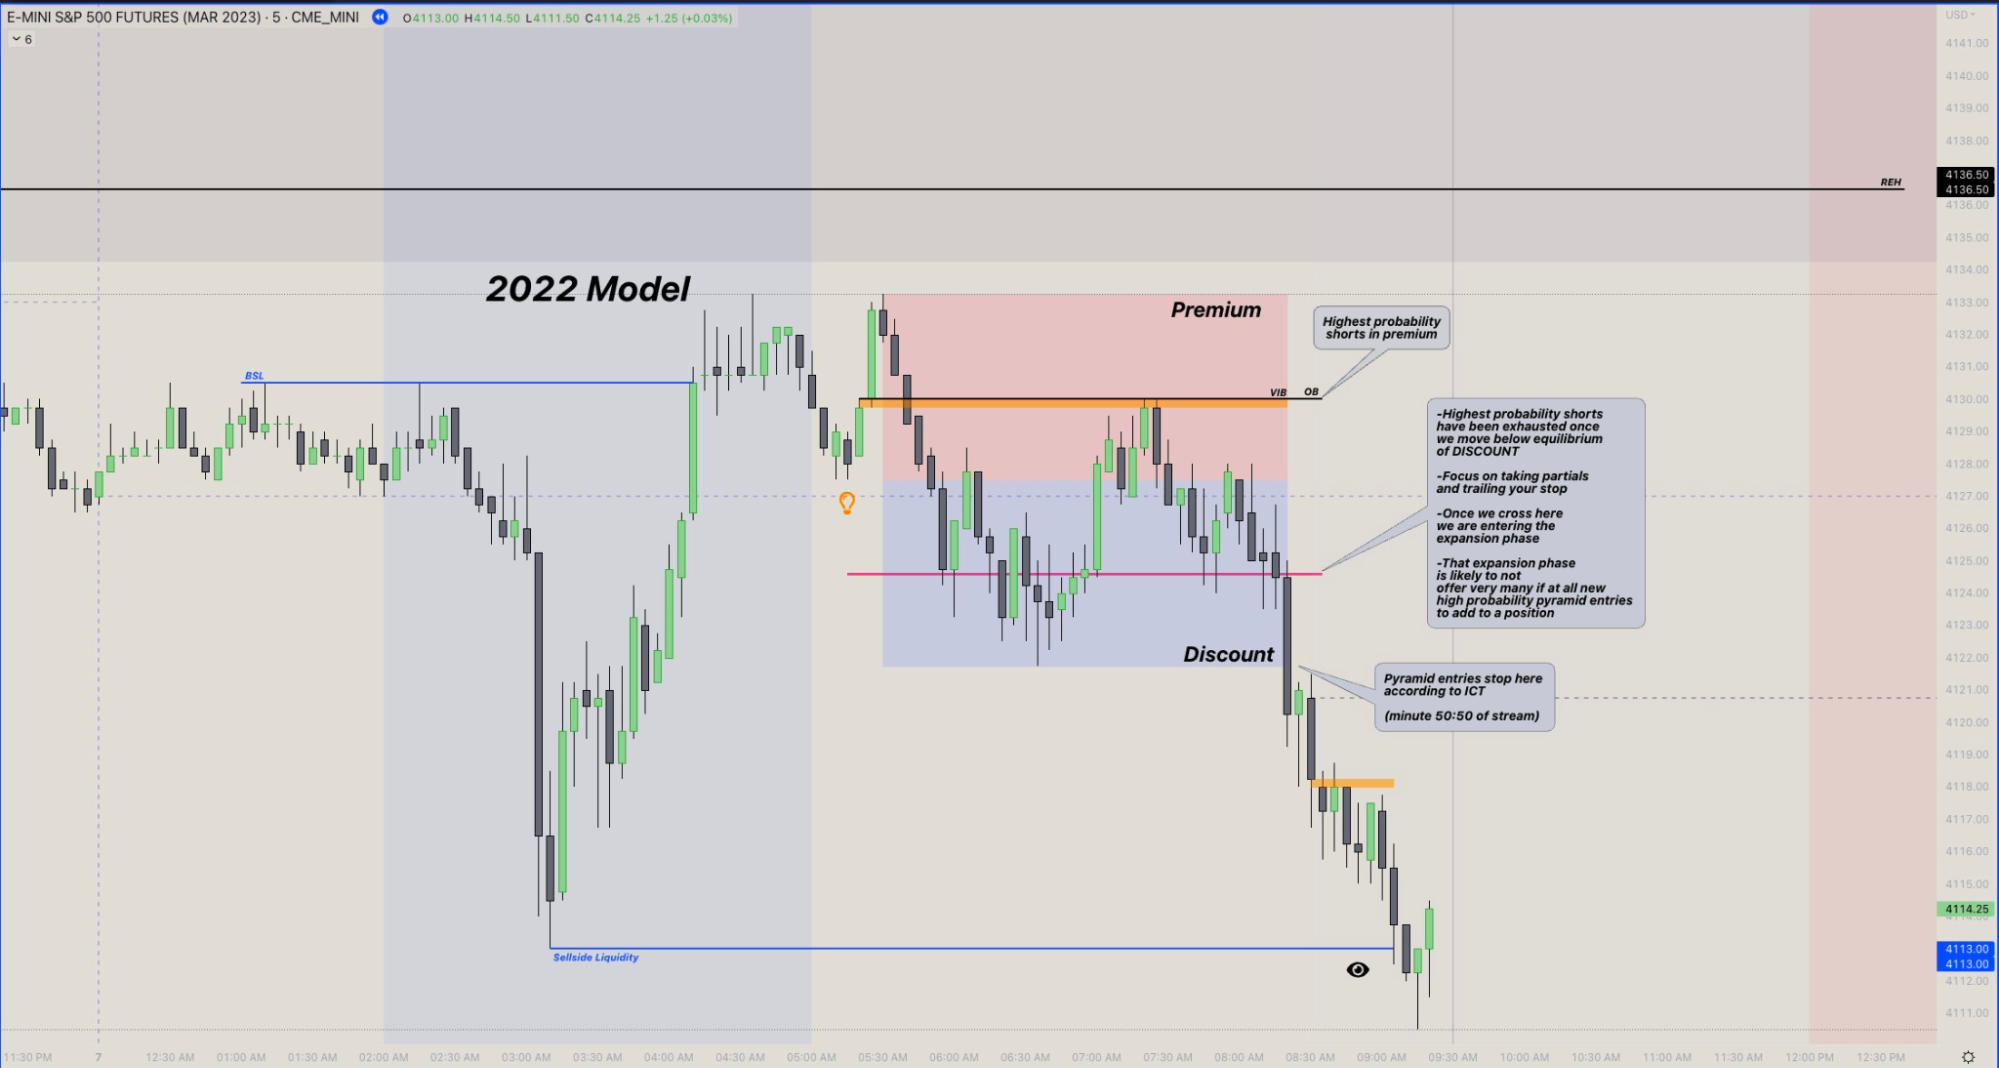
Understanding equilibrium of discount
Highest probability shorts have been exhausted once we move below equilibrium of DISCOUNT
[top]
Understanding low probability conditions
Key Lesson: If you have 2 equally probable outcomes you are trading in low probability conditions and essentially gambling . Sit on the sidelines and demand more information.
[top]
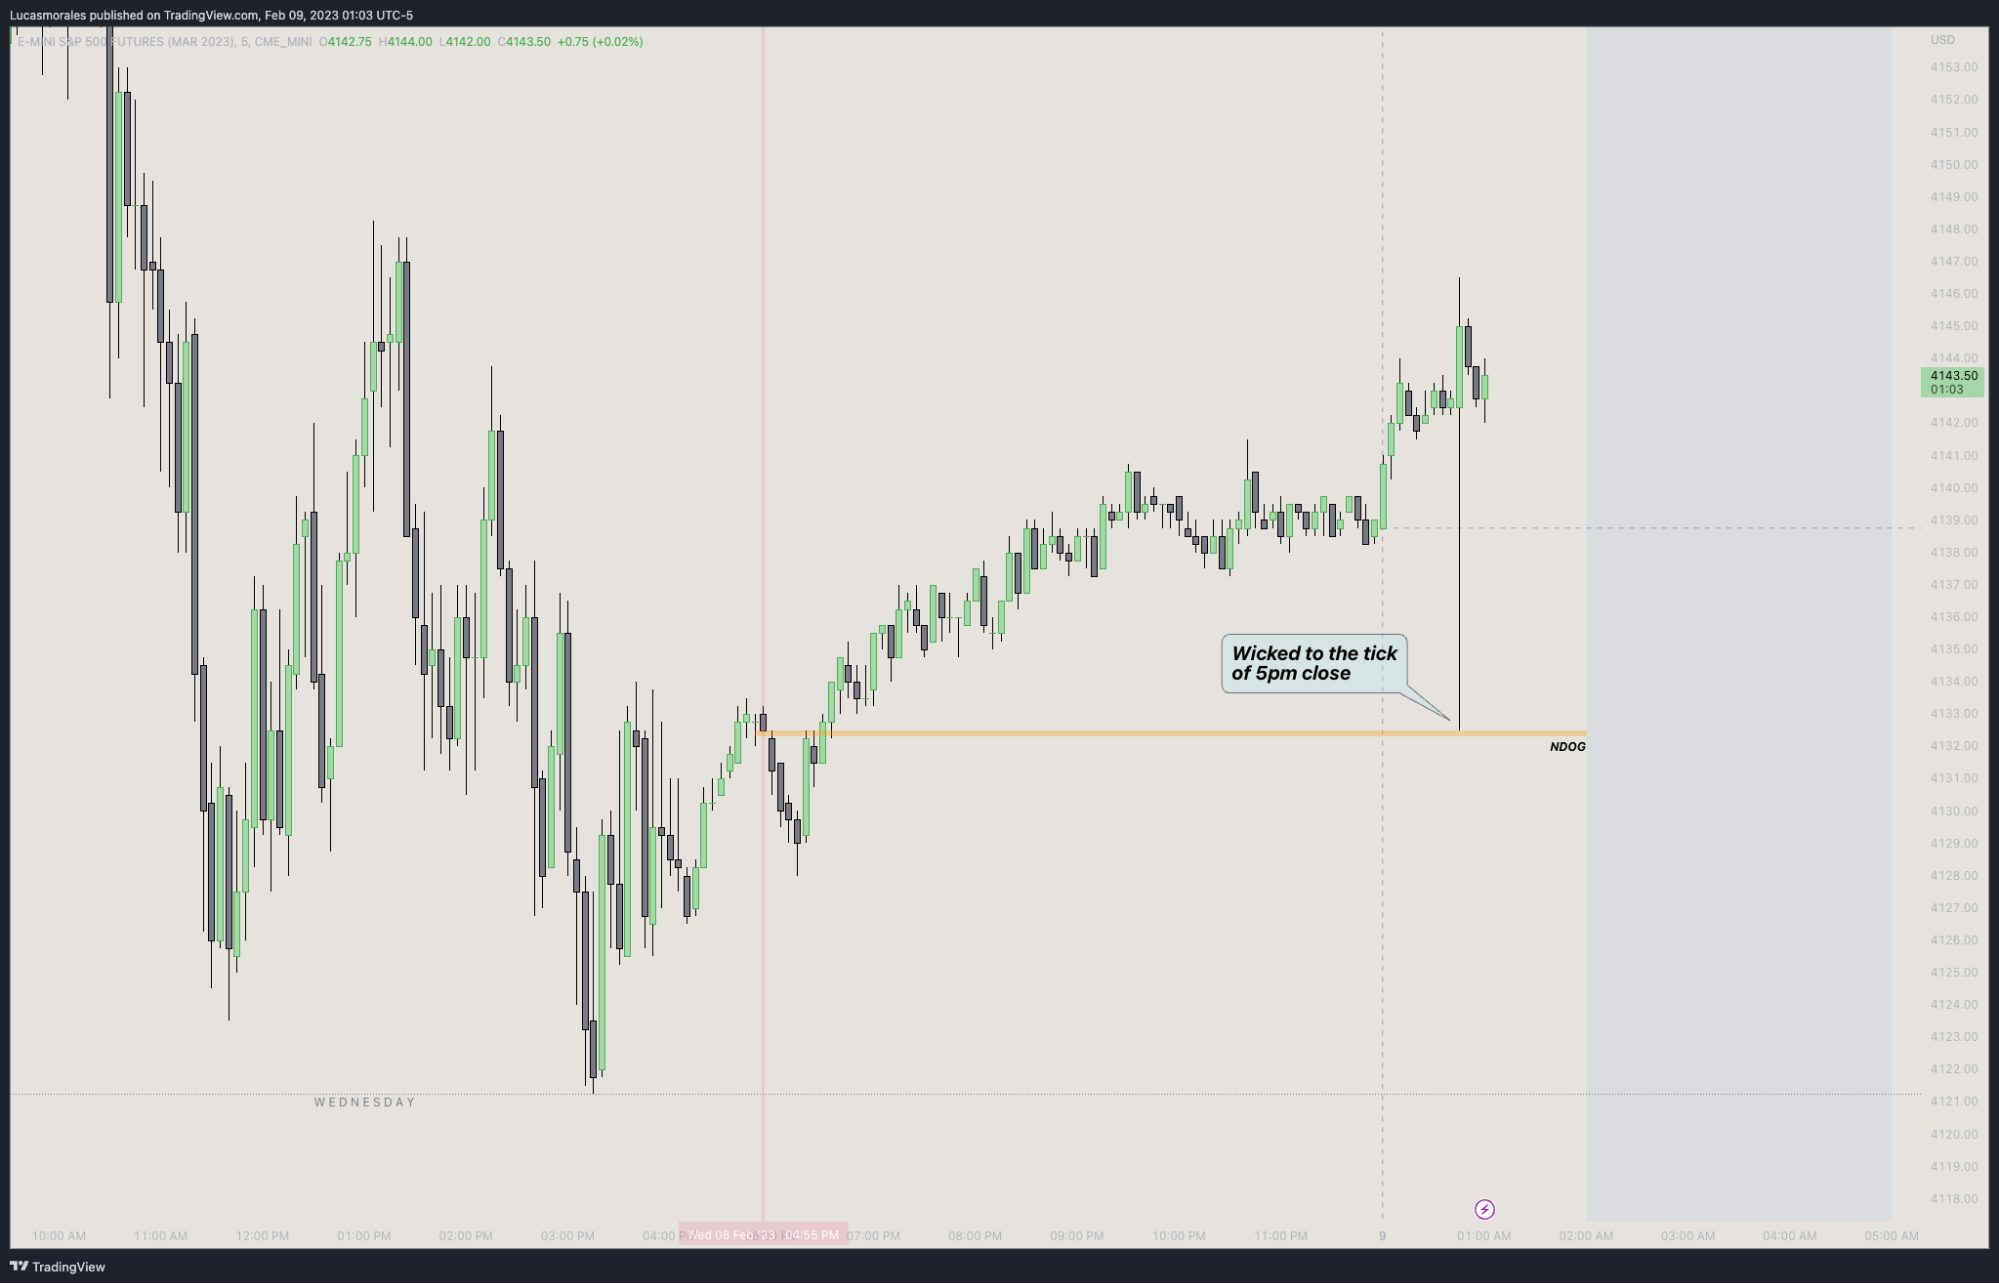
New Day Opening Gap (NDOG)
When we open at 6pm, drag a rectangle from the 5pm closing price to the 6pm open
Extend that throughout the next 12-16 hours. That will act much like you see with the NWOG
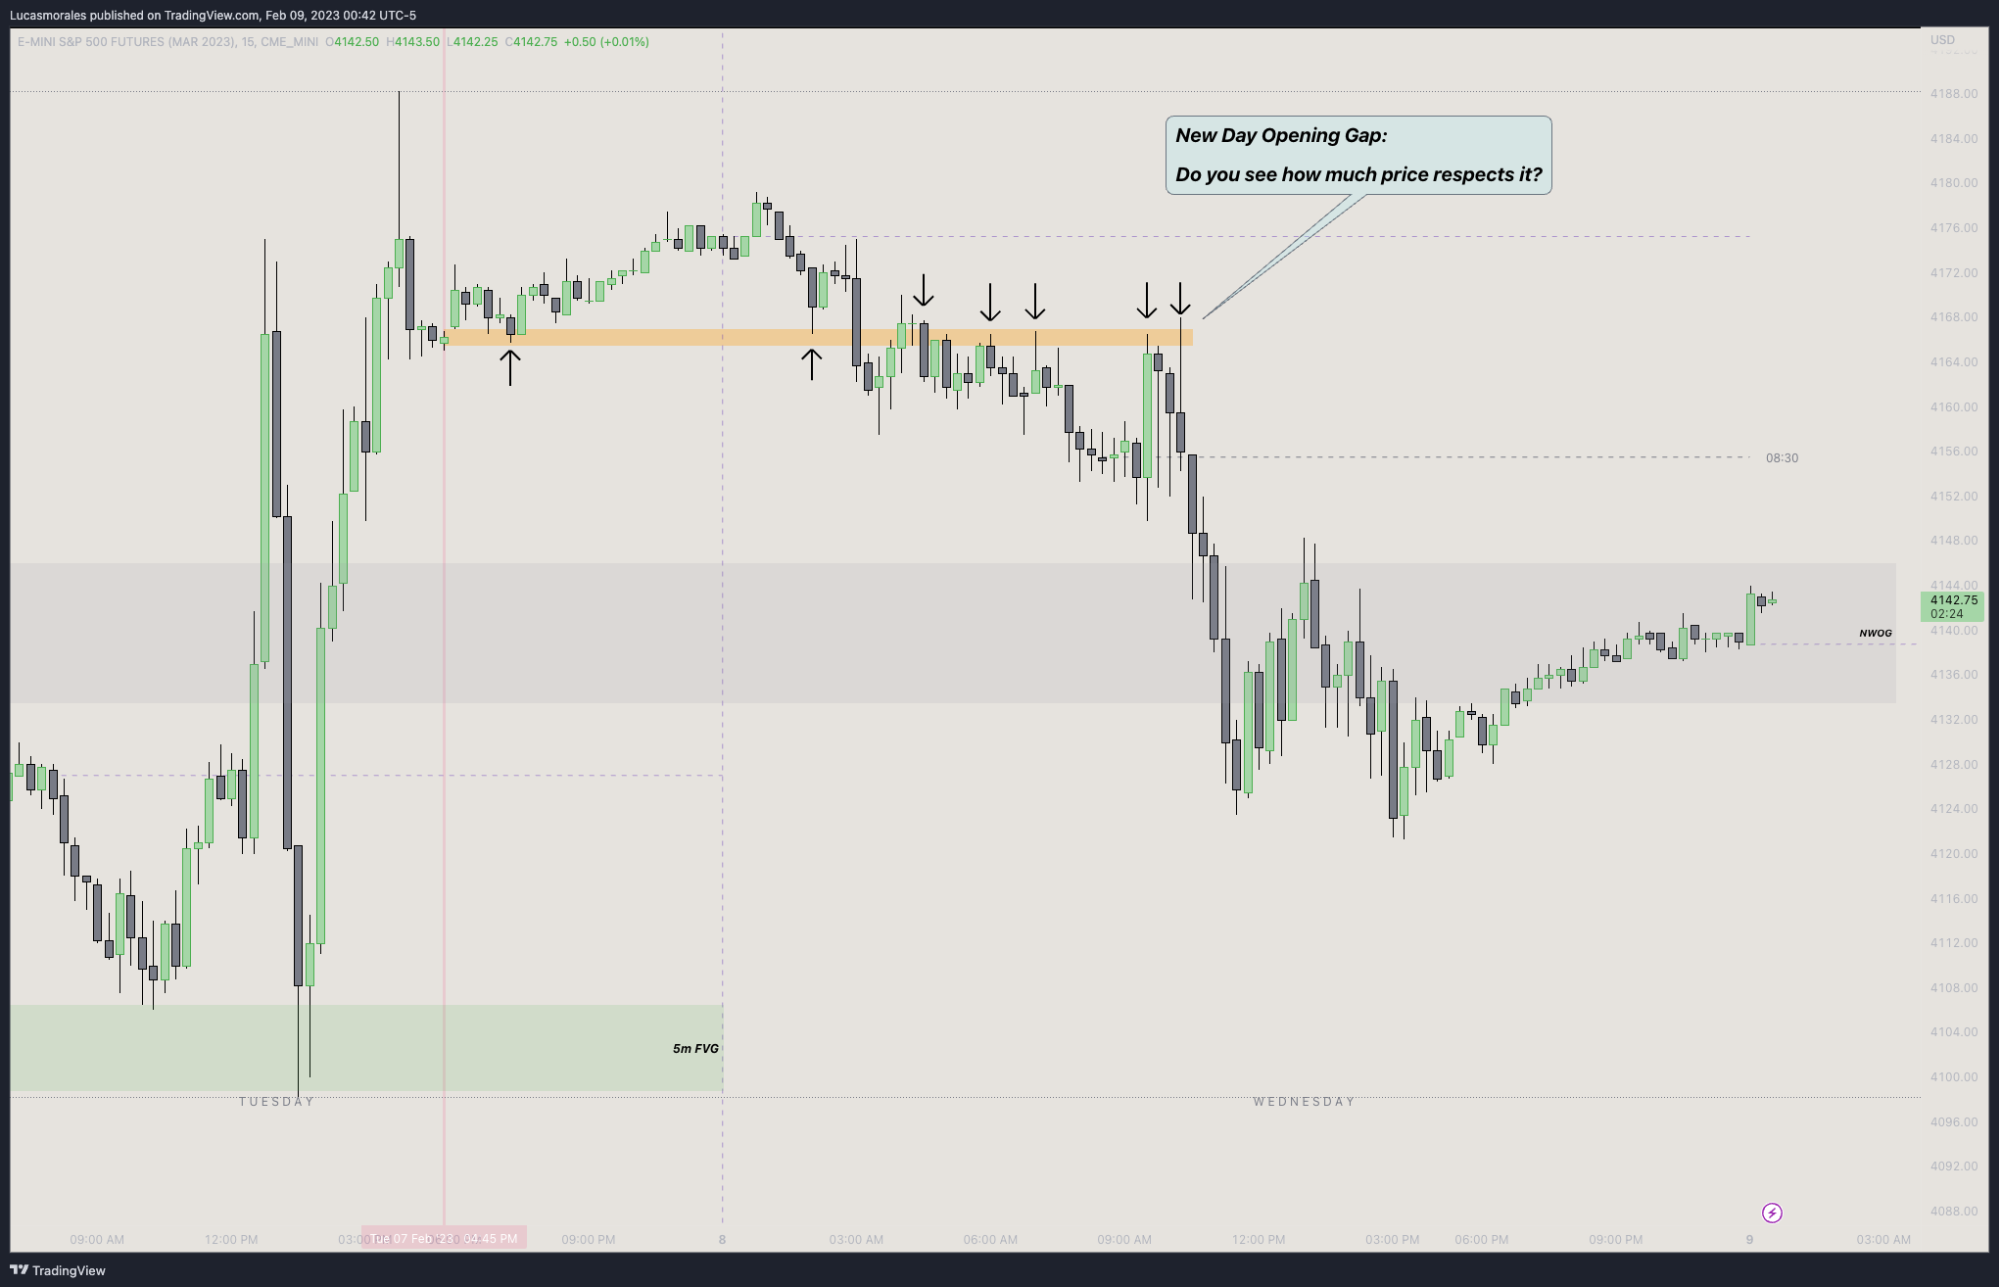
Example of precision with NDOG:
[top]
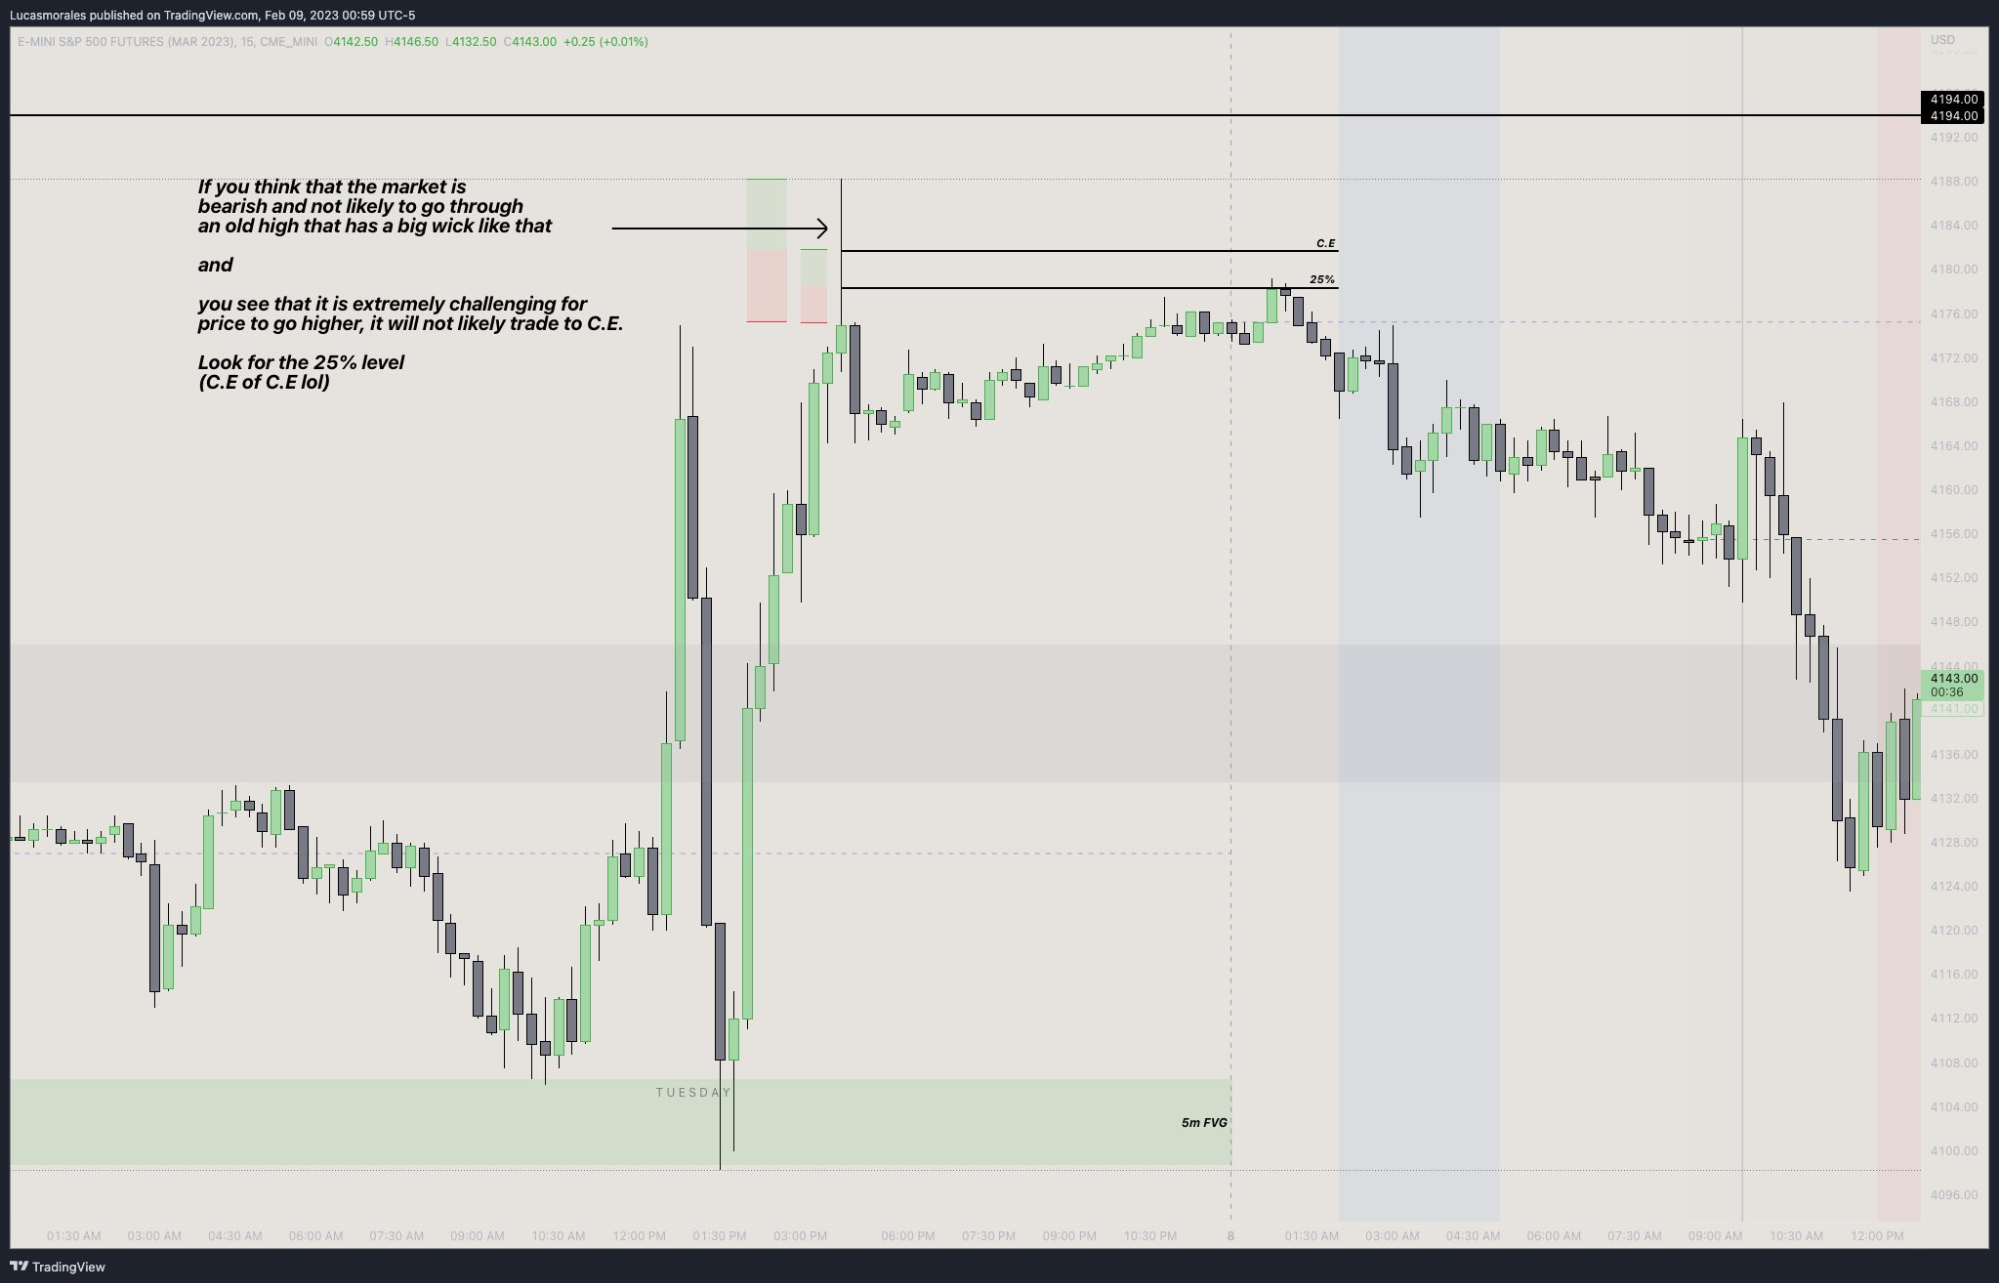
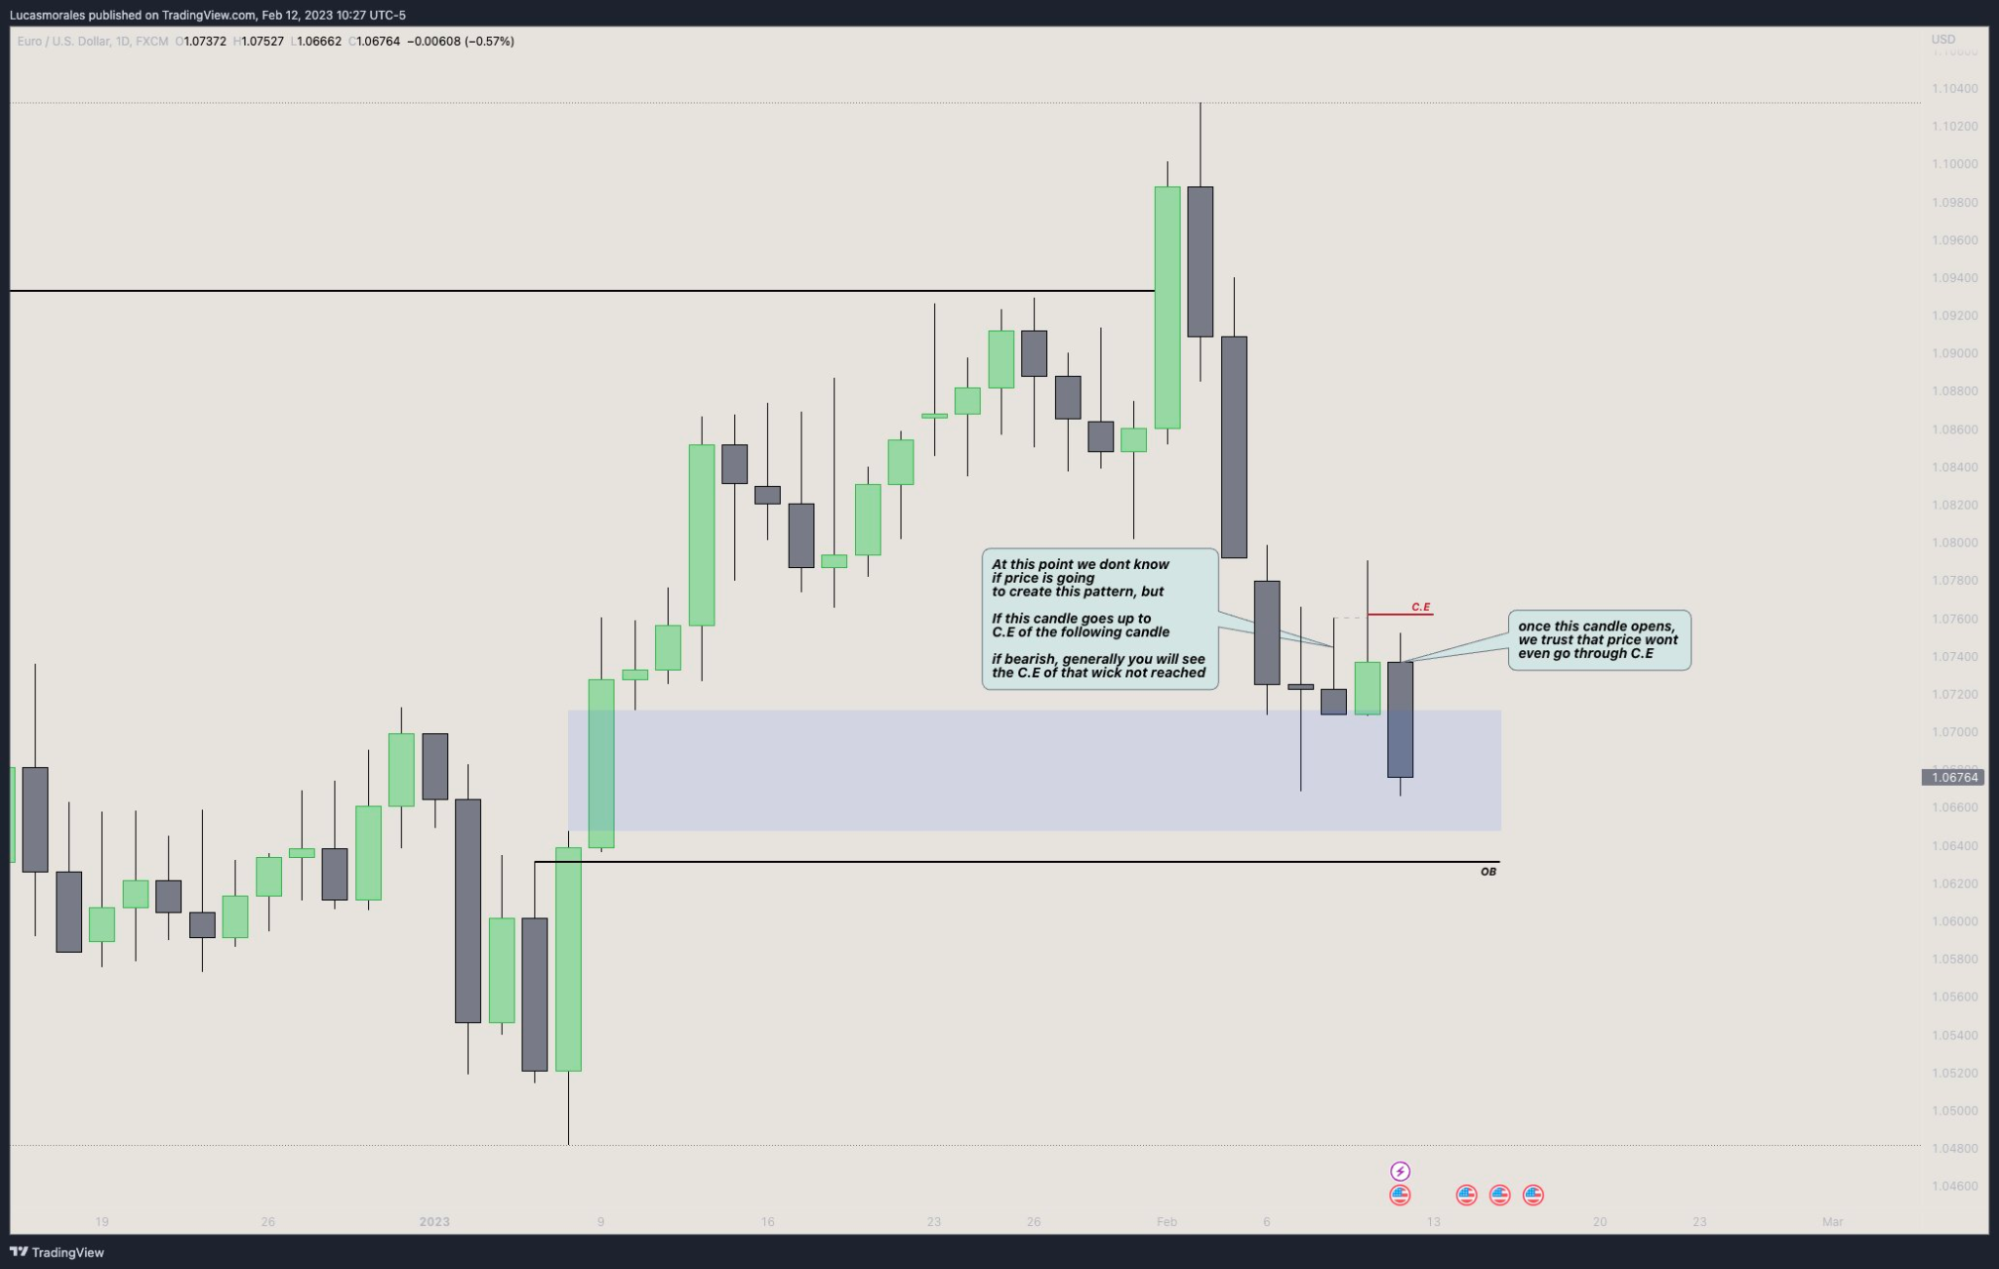
Quarter of the wick
When there is a bearish heavy stance on price, C.E of a wick is likely not to be traded too.
If you suspect that is the case, you get the very specific price level of one quarter of the wick
[top]
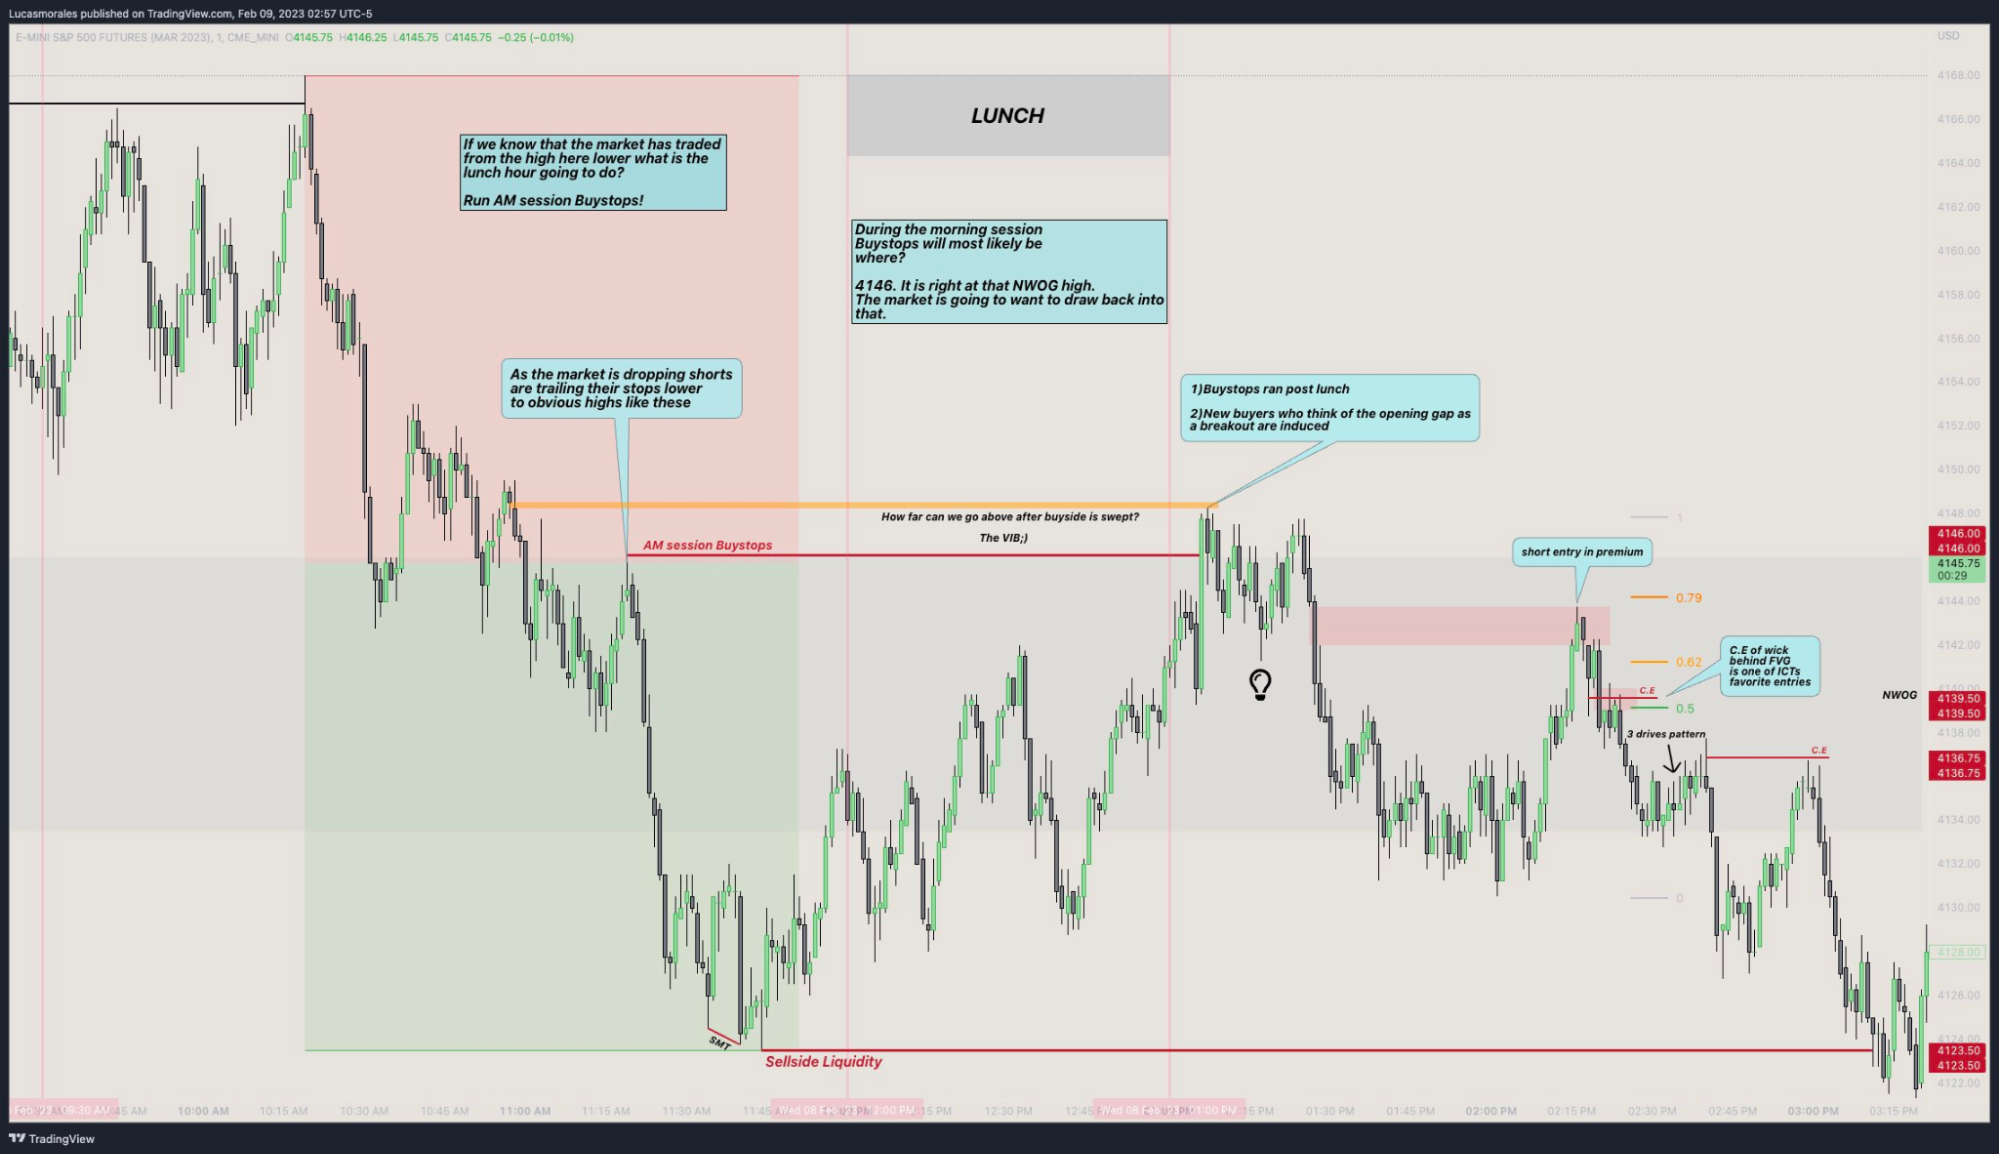
PM session running AM session Buy stops
If you see a trending morning session like below, ask yourself where are shorts trailing their stops?
Expect the PM session to take those stops
ES 1 min
[top]
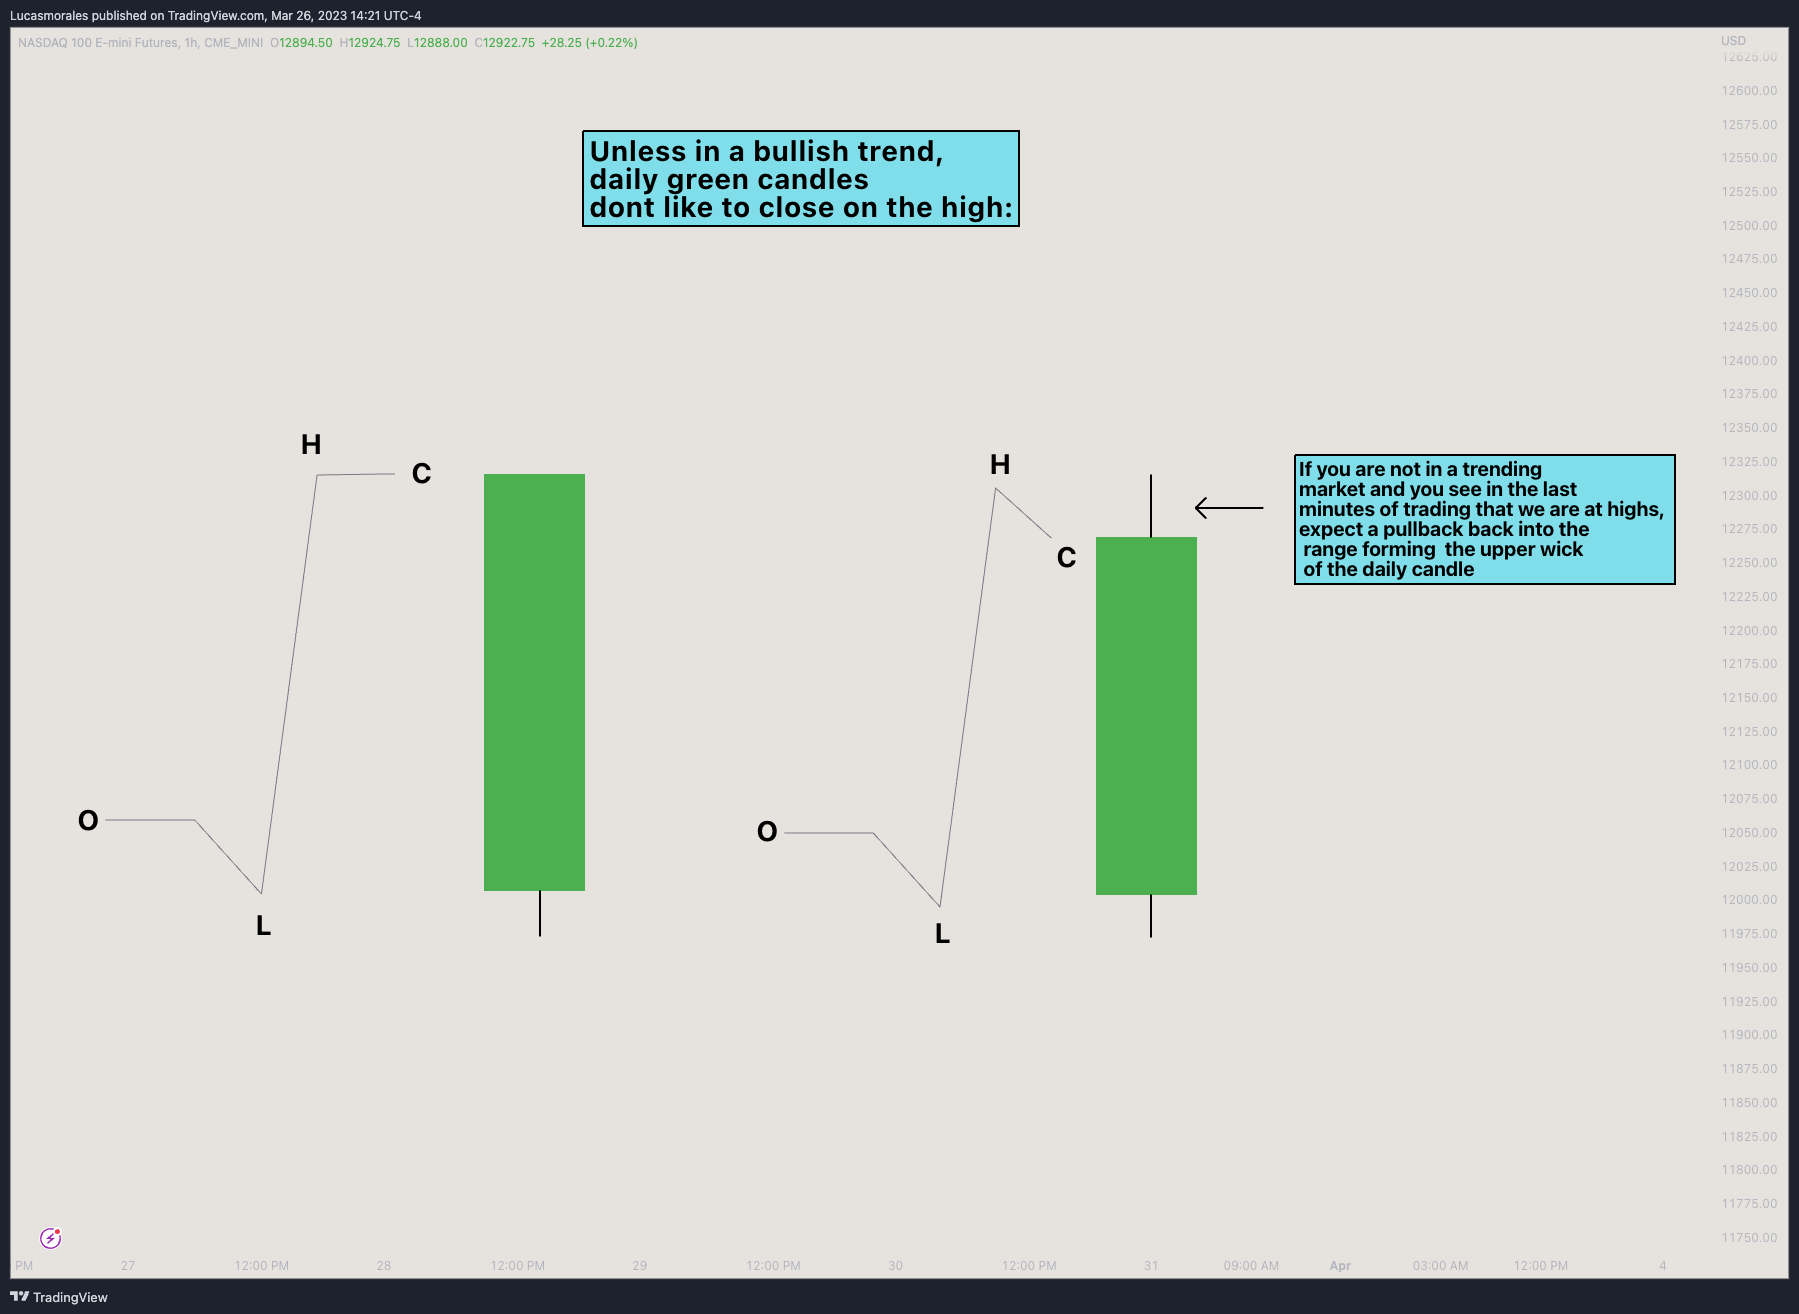
Market on close Macro
In a up close day rarely do you see the candle close on the high unless its a trending day.
Typically it creates the intraday HOD then pulls away from it and closes near the high.
This is the market on close Macro
[top]
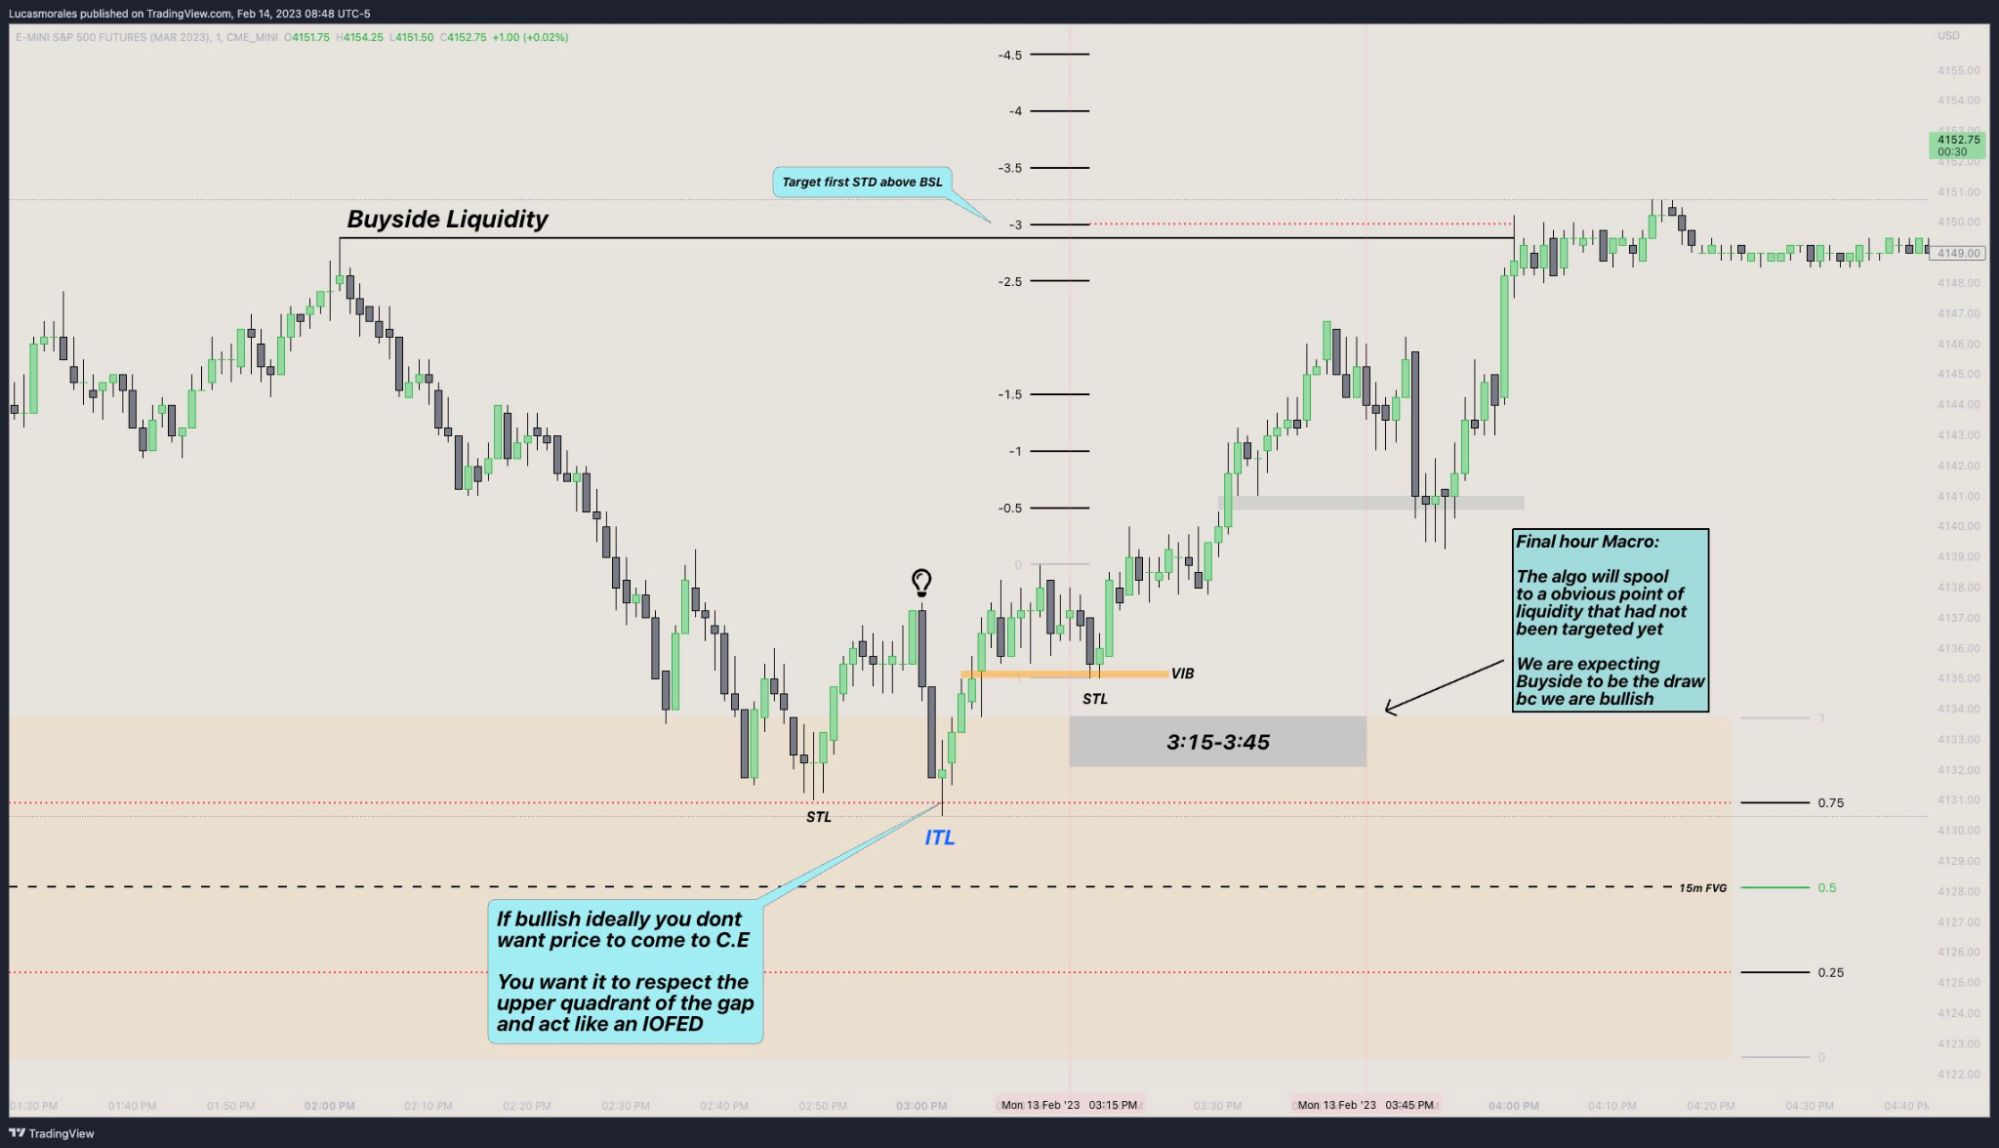
3:15-3:45 Sweet Spot
Generally you will find between 3:15-3:45pm a sweet spot to place a trade if we know where we are looking for liquidity.
Above the market place if bullish
Below the market place if bearish
OR
if there is an imbalance we will look to rebalance it
The algo will spool to a obvious point of liquidity that had not been targeted yet
Example
[top]
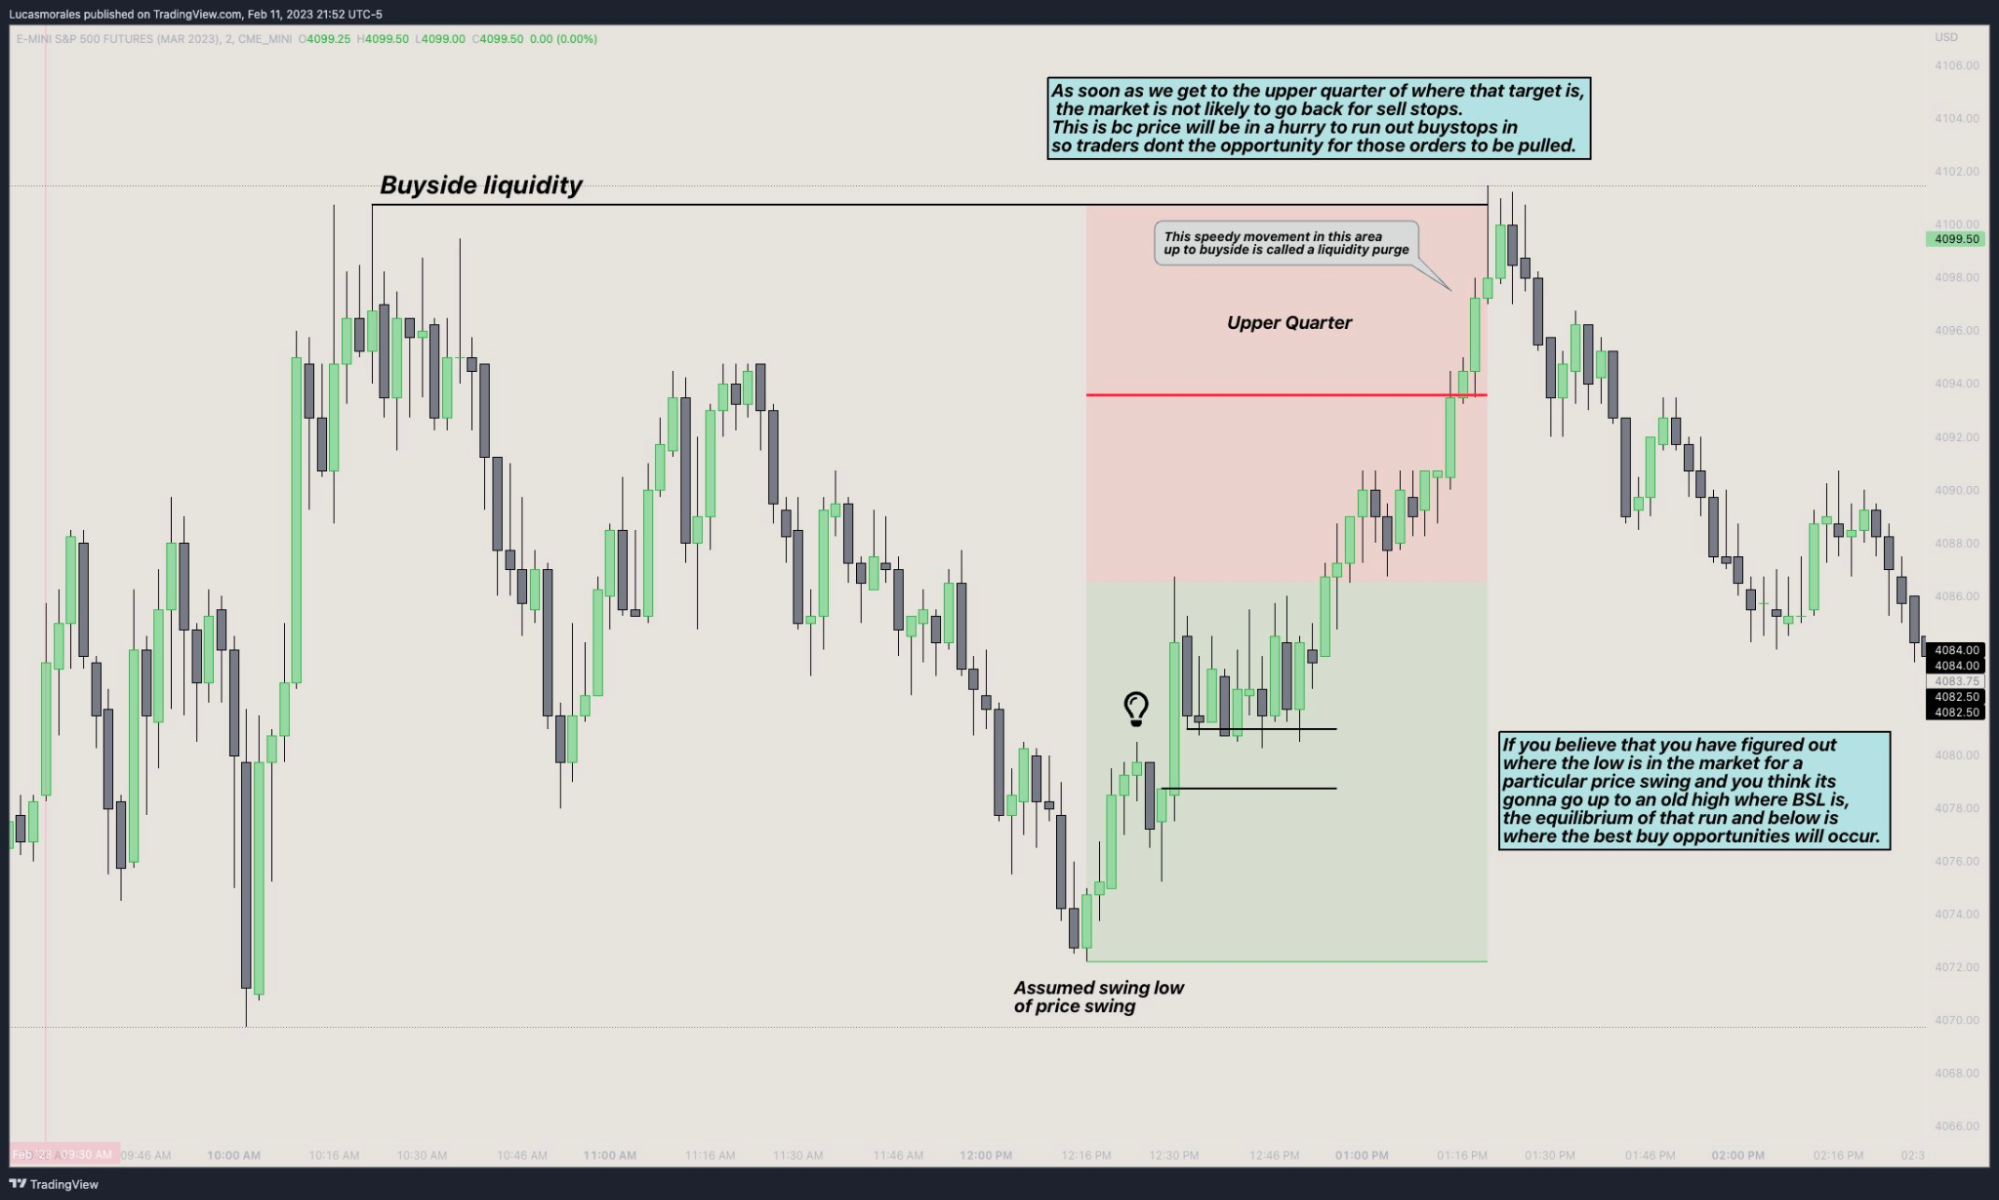
The Upper Quarter Concept
If you believe that you have figured out where the low is in the market for a particular price swing and you think its gonna go up to an old high where BSL is, the equilibrium of that run and below is where the best buy opportunities occur.
As soon as we get to the upper quarter of where the target is, the market is not likely to go back for sell stops. This is because price will be in a hurry to run out Buy stops in so traders don't get the opportunity for those orders to be pulled.
ES 2m
[top]
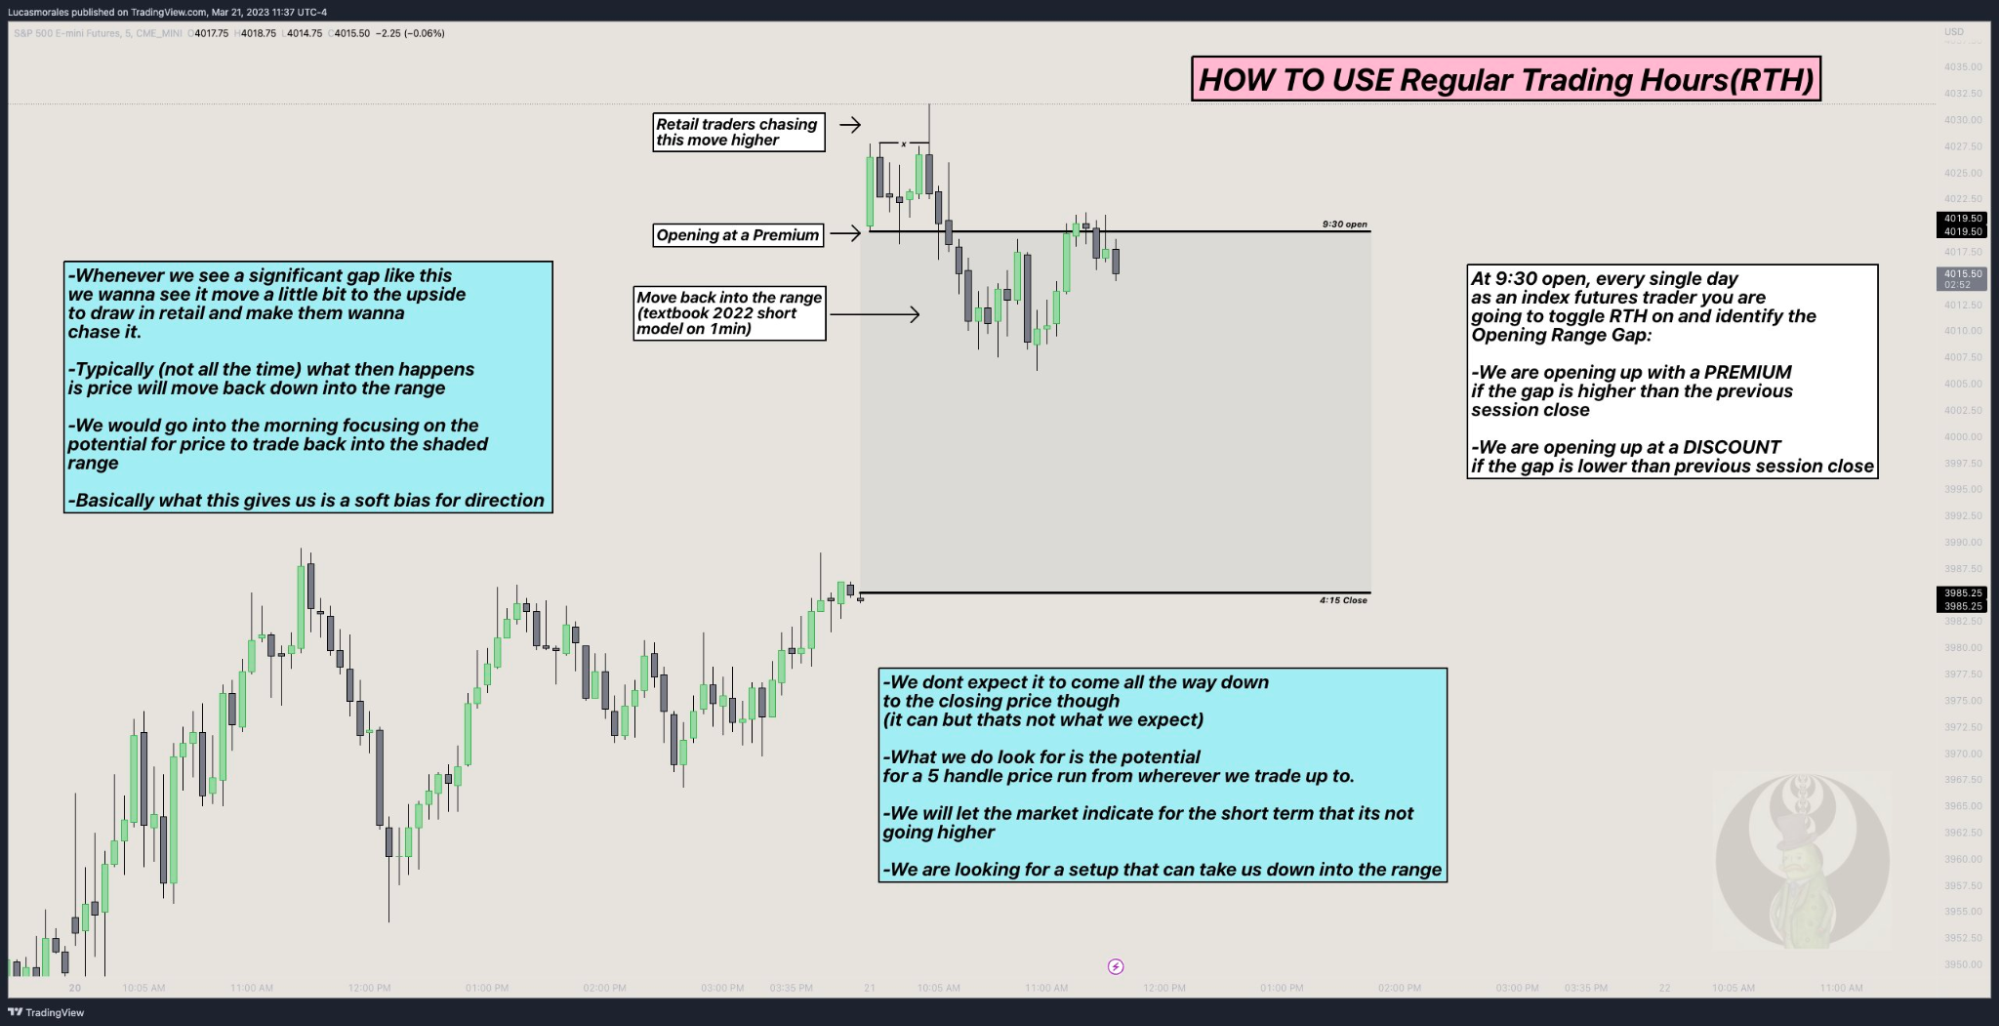
Regular Trading Hours (RTH)
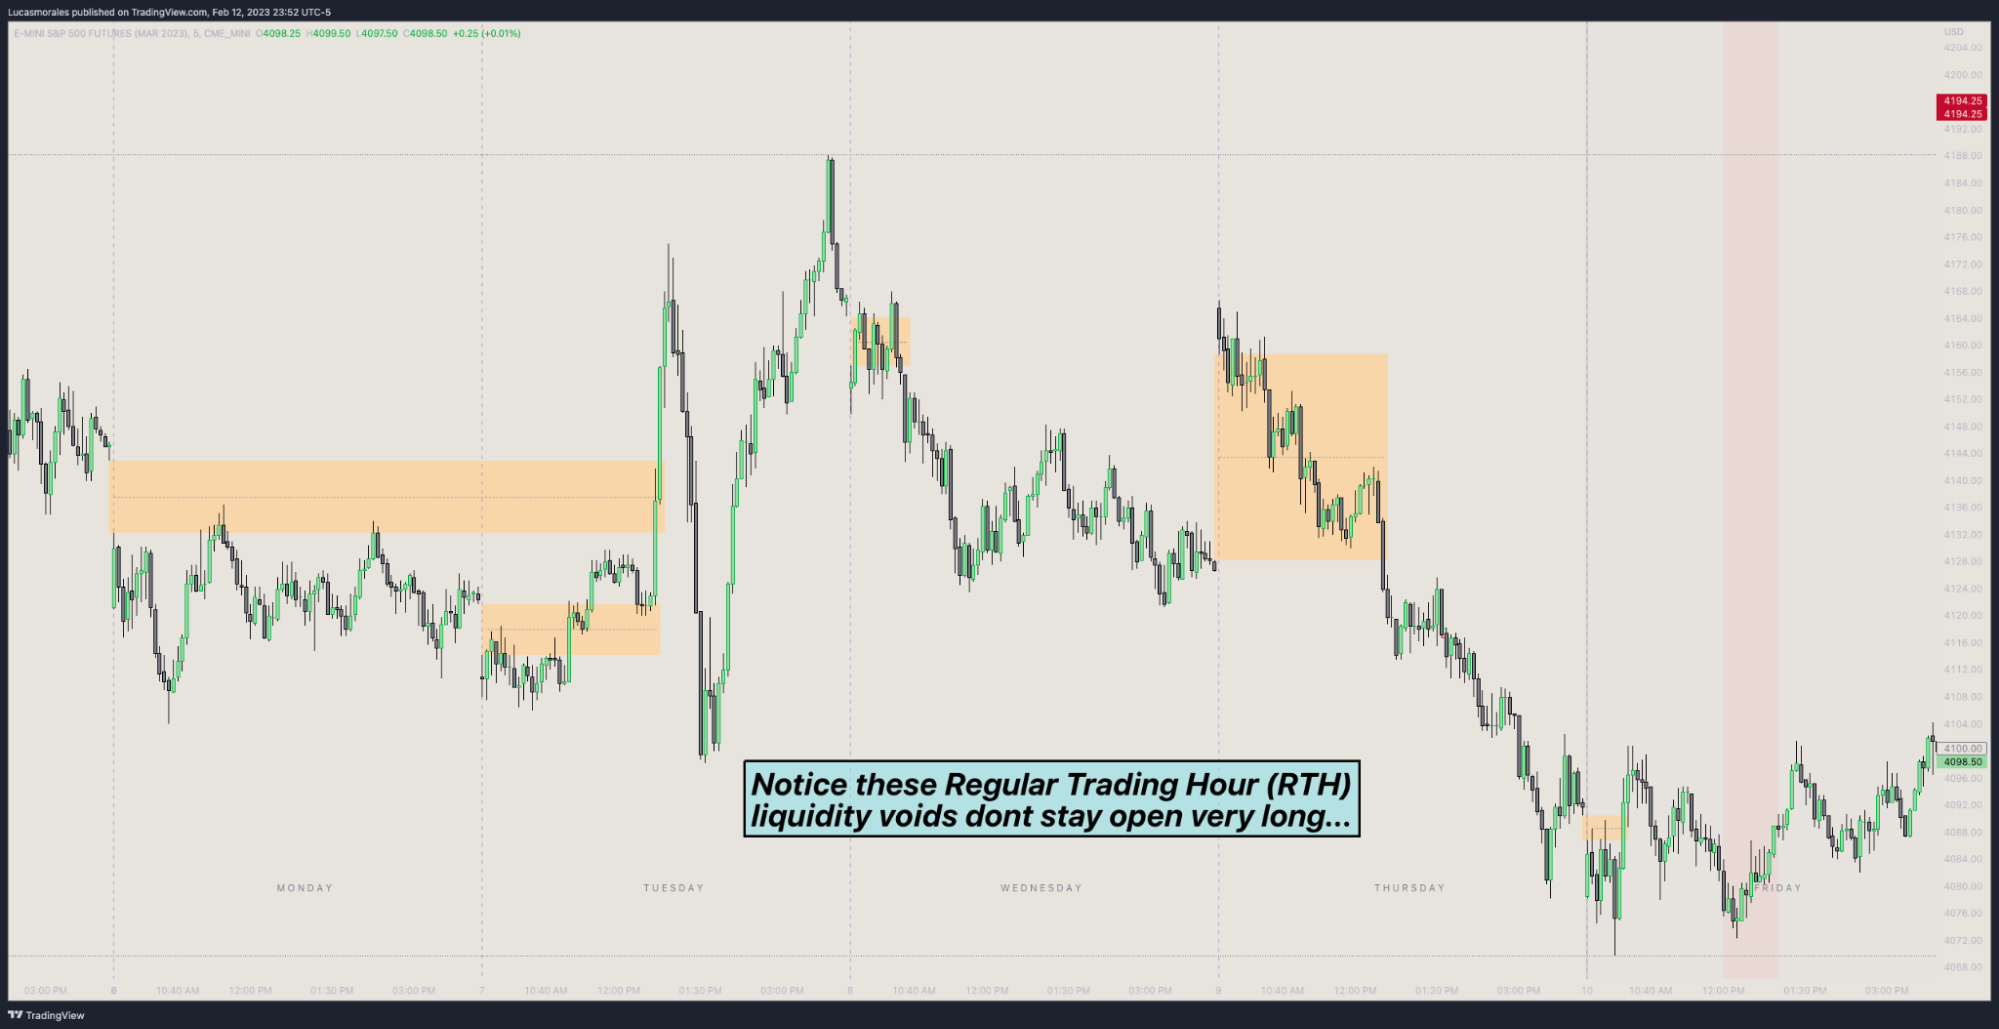
When trading futures indices you need to also consider how we closed the previous session and where we opened at 9:30 because that difference is a REAL Liquidity Void. We call it the Opening range gap.
Price has a tendency to not let these areas stay unfilled for too long.
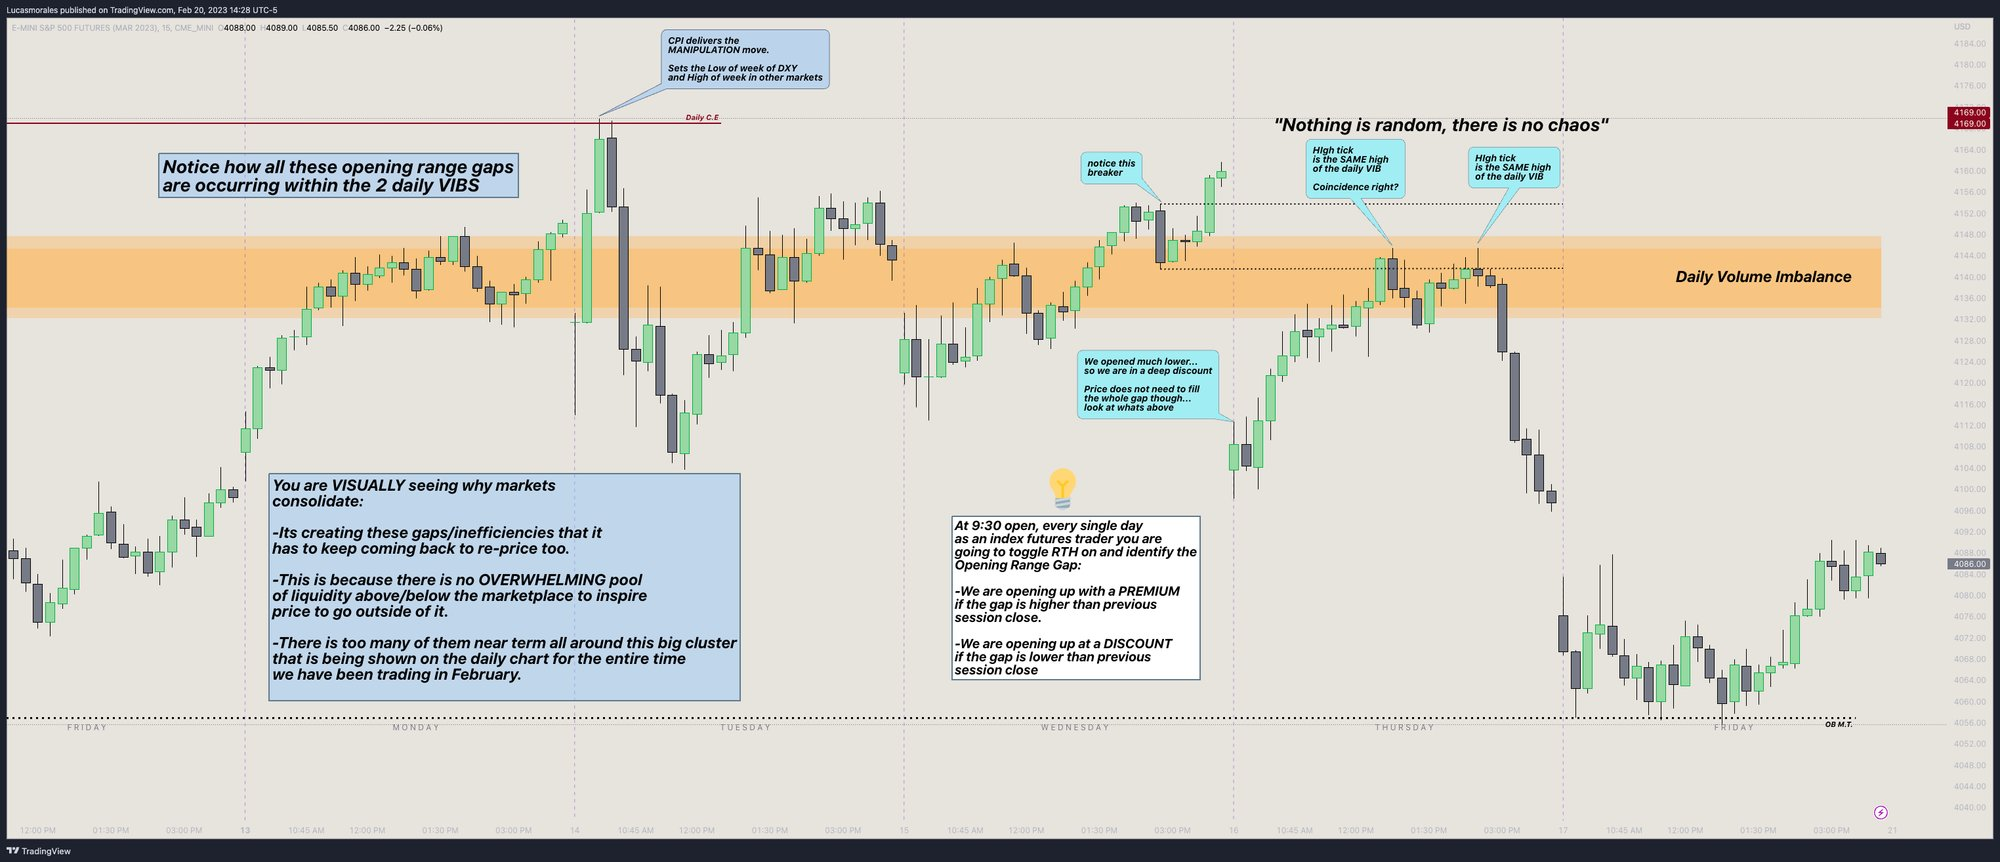
At 9:30 open, every single day as an index futures trader you are going to toggle RTH on and identify the Opening Range Gap:
We are opening up with a Premium if the gap is higher than the previous session close
We are opening up at a Discount if the gap is lower than the previous session close
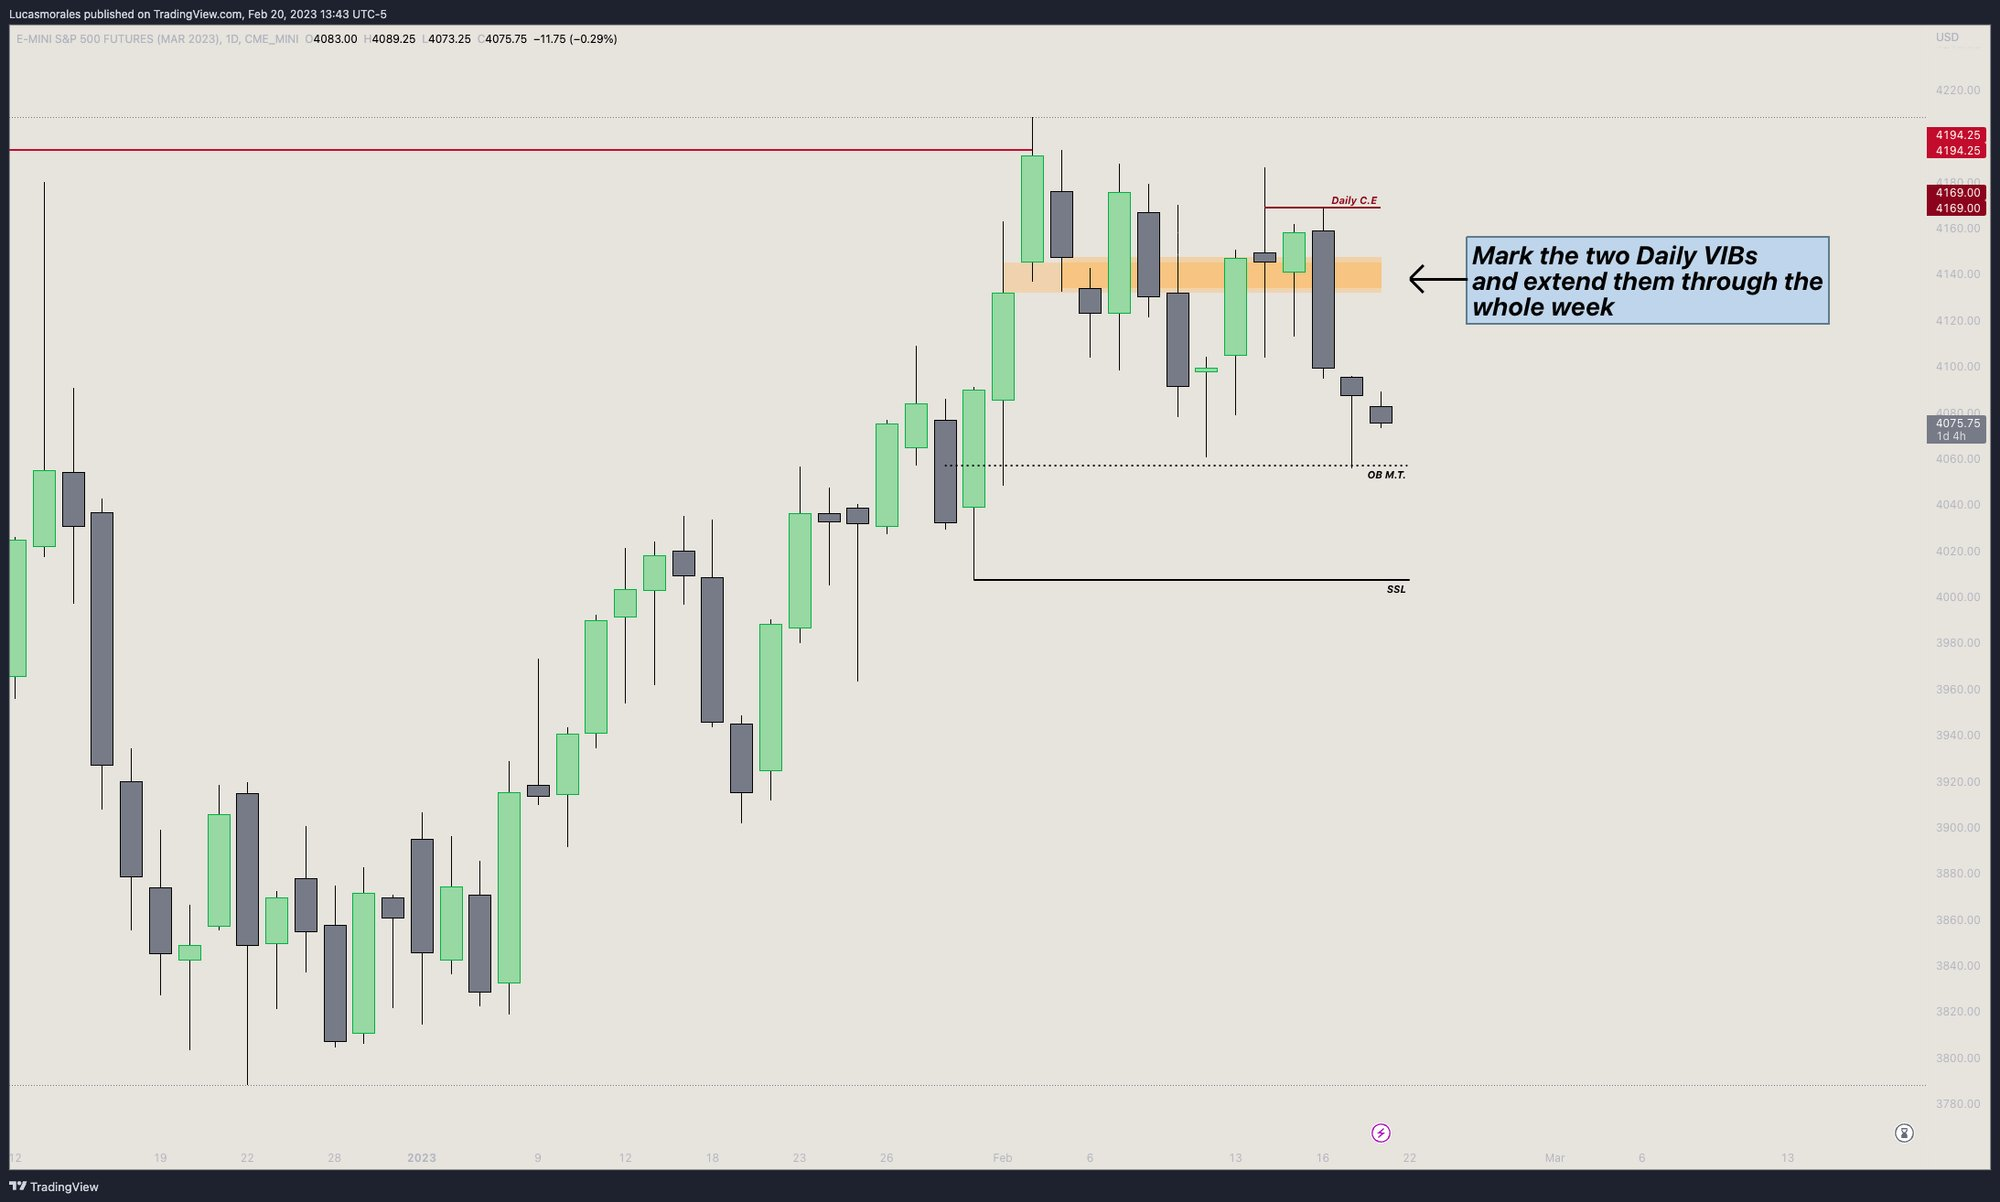
Reviewing the relationship between the Daily VIBs and RTH gap + Understanding opening at a premium/discount of RTH:
[top]
When to expect Seek and Destroy conditions
1) On the heels of any holiday that impacts normal trading hours the very next trading session, the morning is likely to be VERY low probability/choppy. The market is more prone to seek and destroy conditions
(For example on Monday the market is closed due to a bank holiday, expect a choppy AM session going into Tuesday)
-Let the market fall back to its normalcy
-Only retail traders are rushing to the markets on a day like this like gamblers at a casino
2) Higher Time frame target is delivered prior to 9:30 am open expect a choppy AM session
3) Asia High and Low are raided during the London session. Then London High and Low are raided during NY creating a broadening formation
[top]
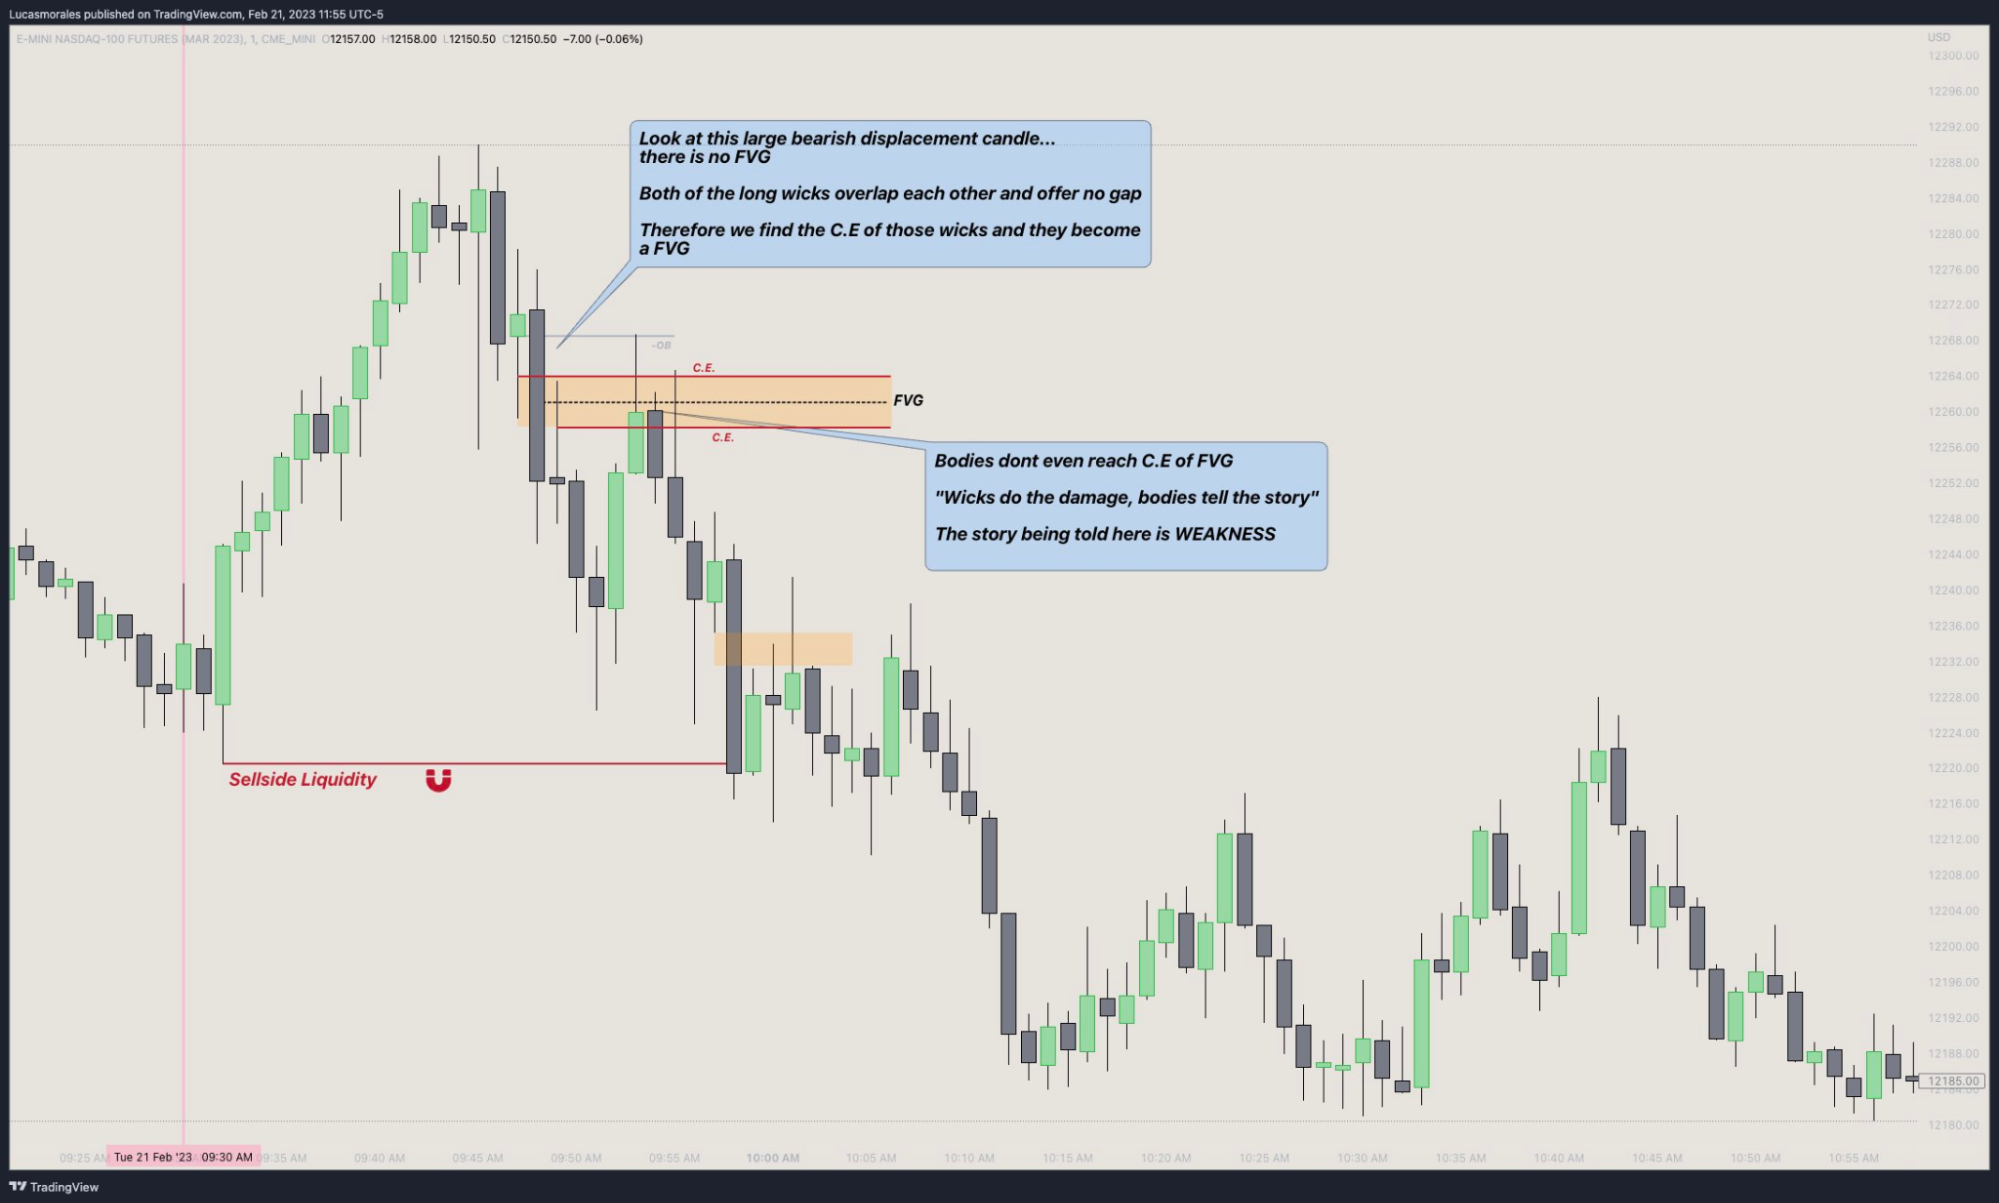
Implied FVG
How to identify a FVG when there is no "gap" and only overlapping wicks
[top]
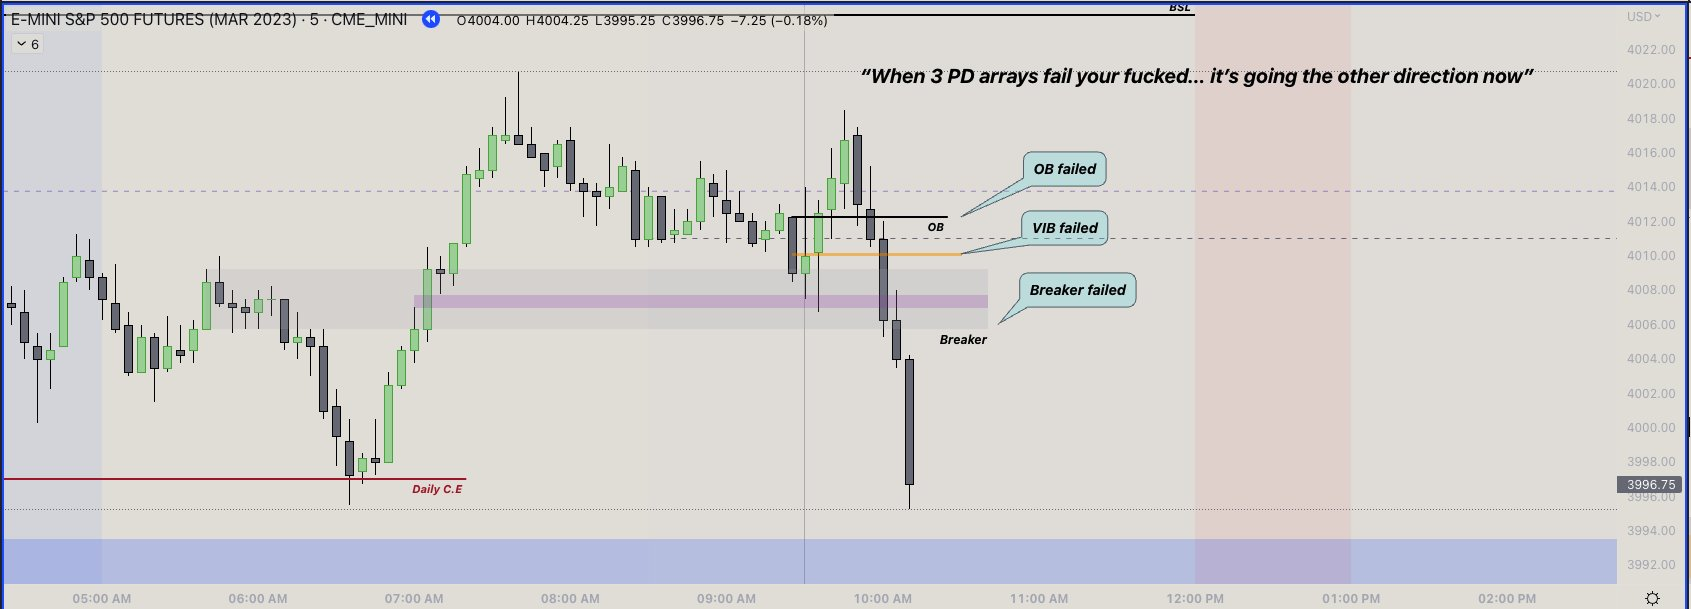
When 3 PD Arrays fail your fucked
"When 3 PD arrays fail your fucked... it's going the other direction now"
[top]
A CLOSE below the swing low that we would see as being a Market Structure Shift, we treat it as a Breaker
[top]
3 candle price action signature
[top]
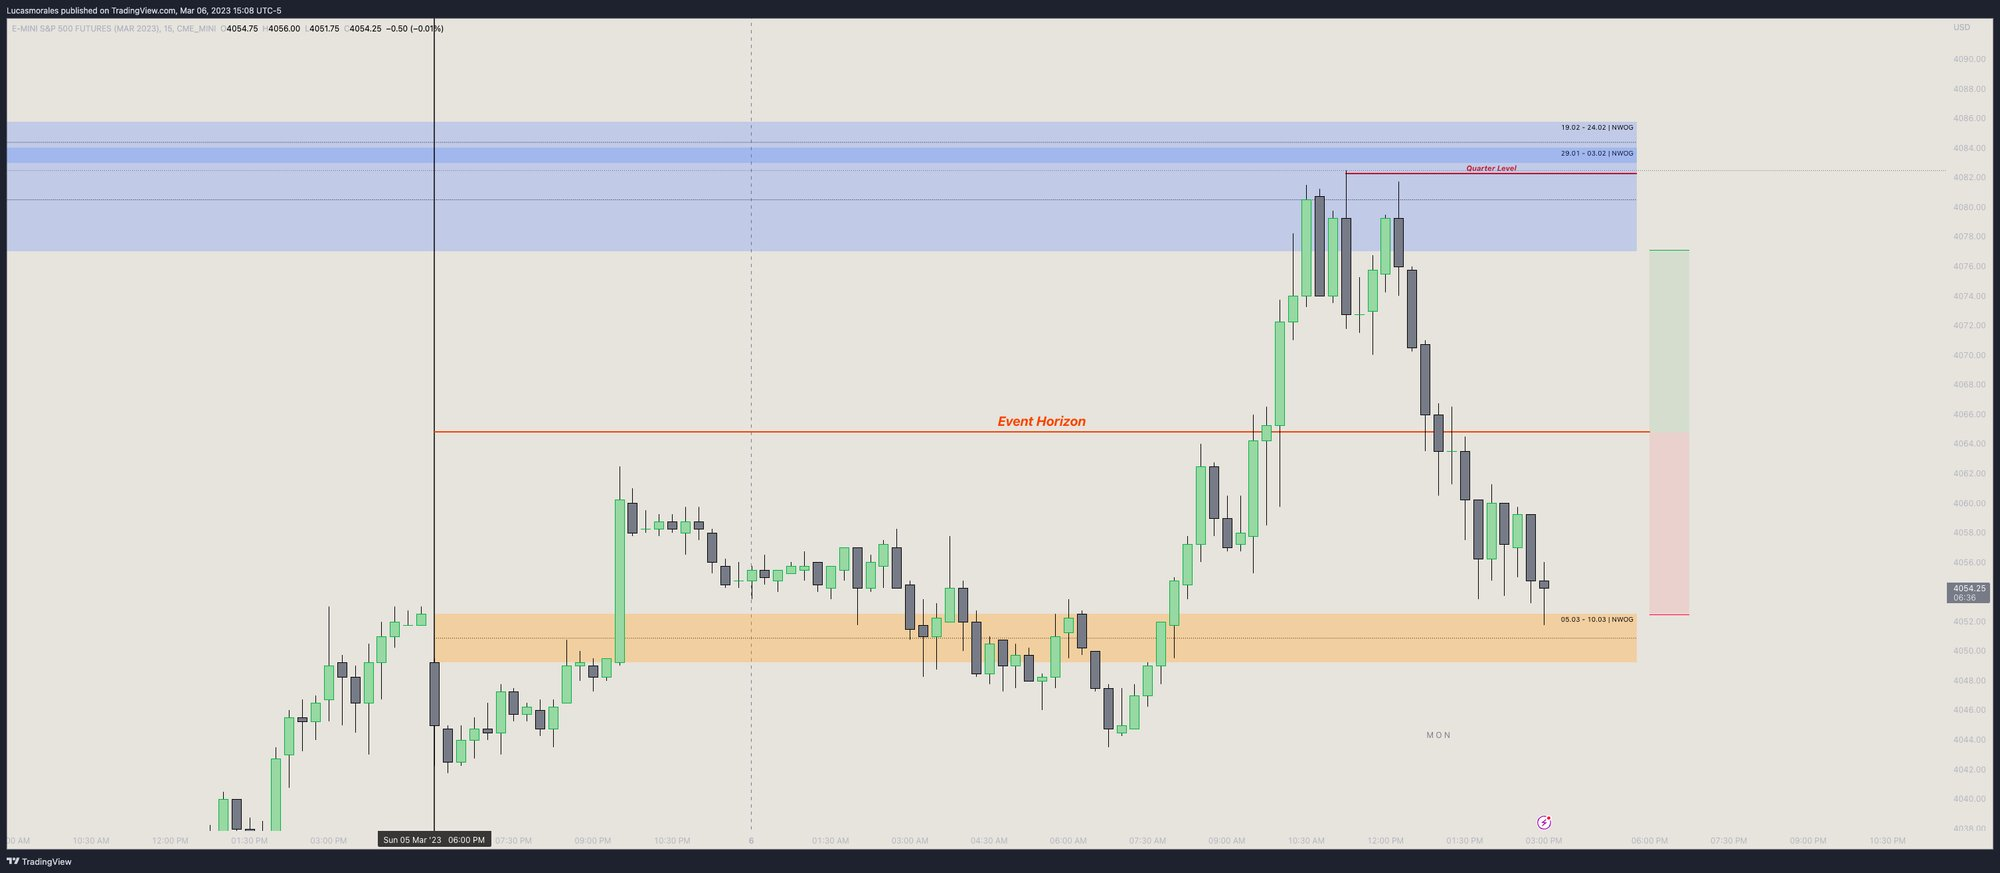
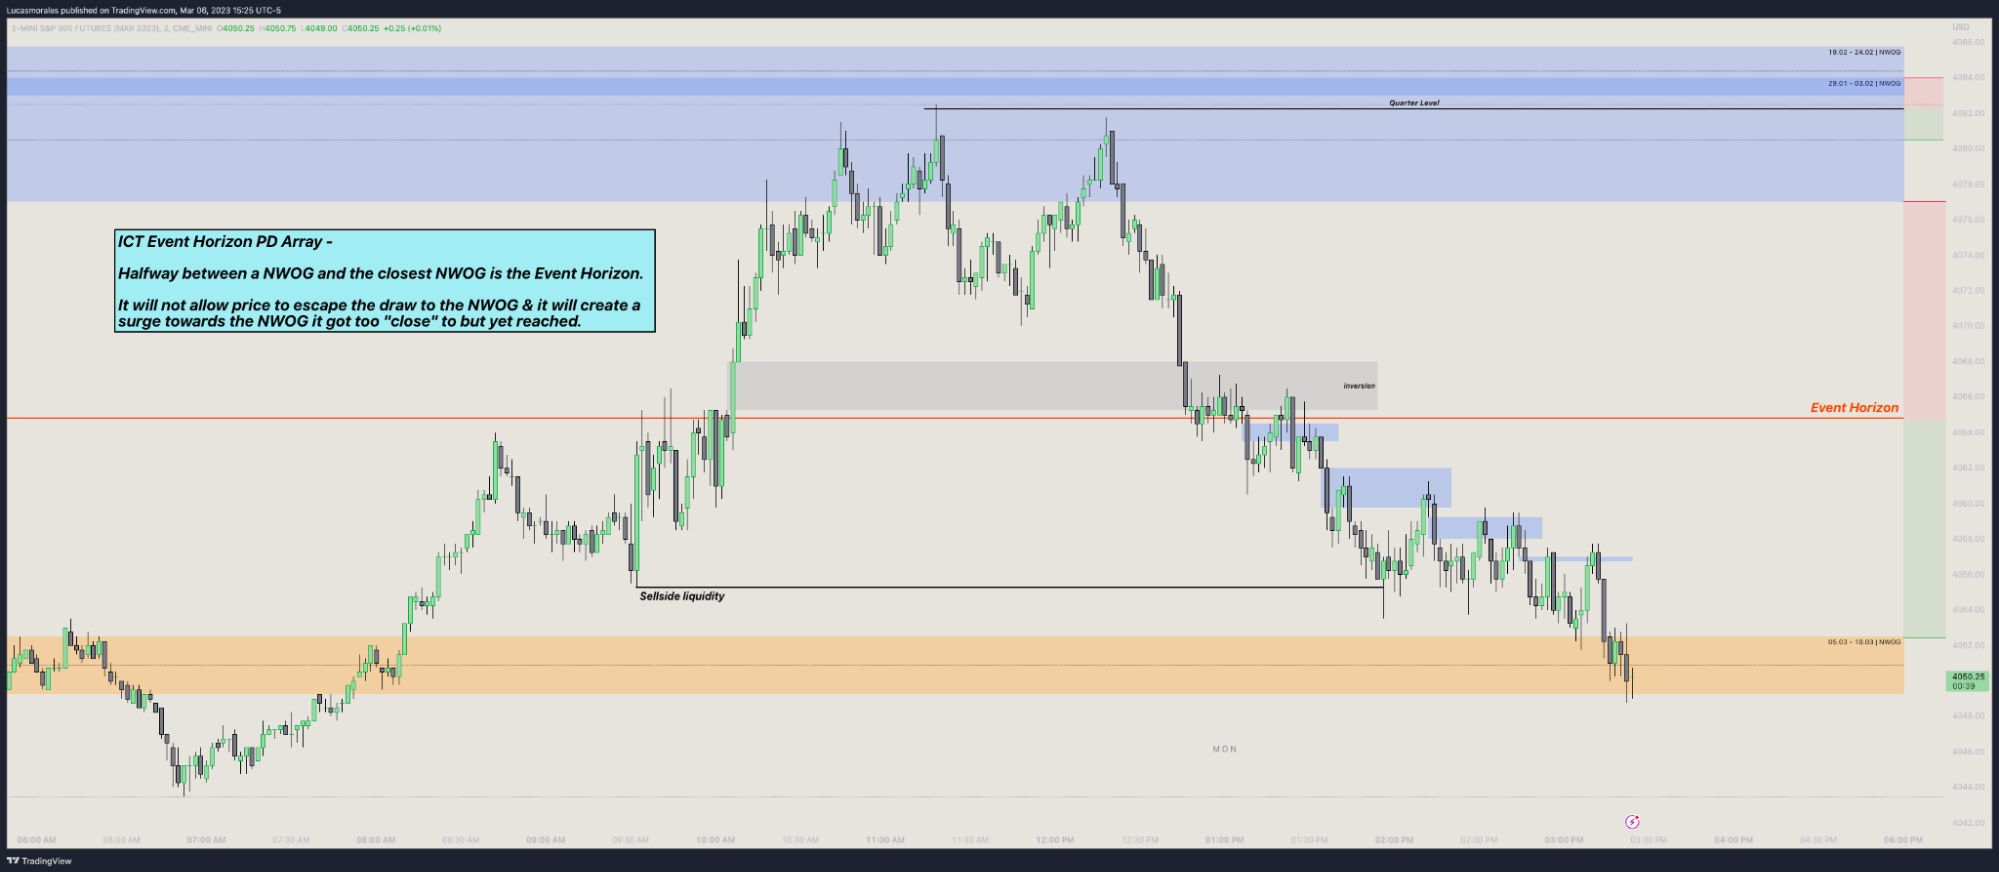
Event Horizon
Half way between a NWOG and the closest NWOG is the Event Horizon
It will not allow price to escape the draw to the NWOG and it will create a surge towards the NWOG it got too "close" to but yet reached
Example 1
ES 15m
ES 2m
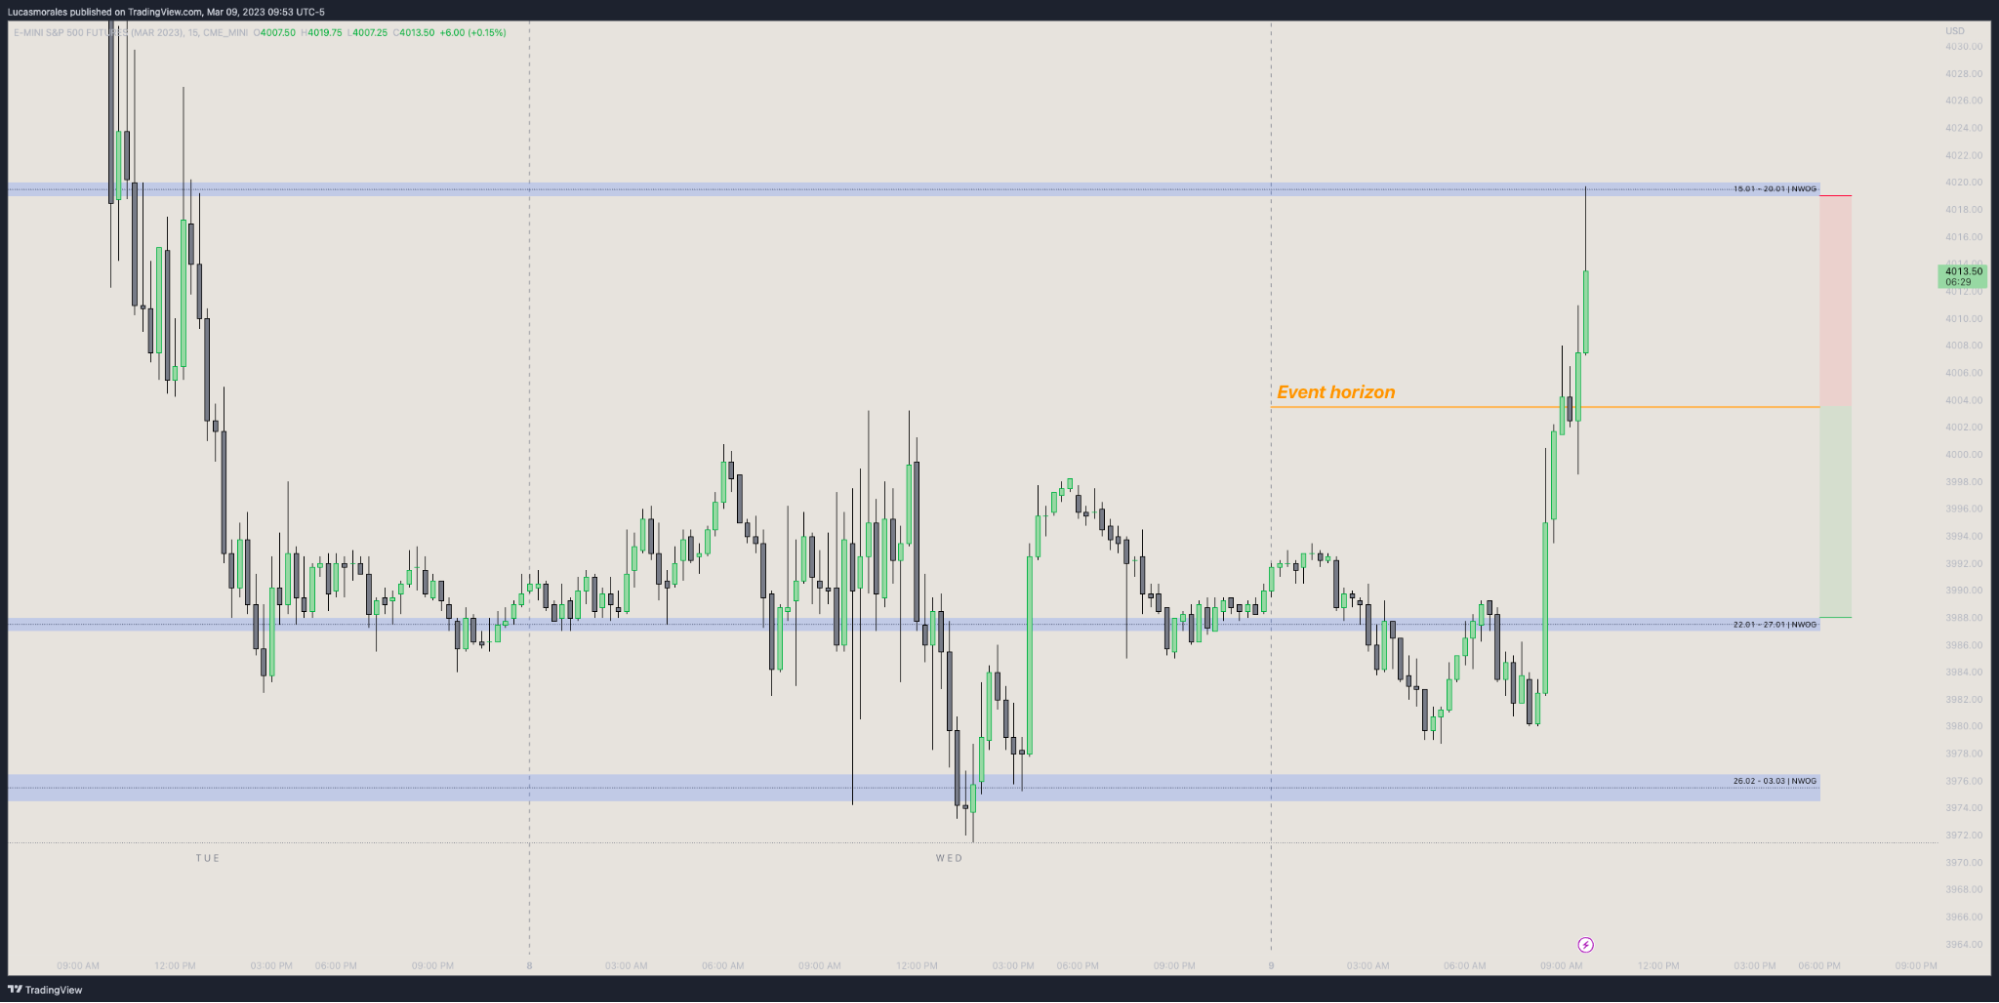
Example 2
ES 15m
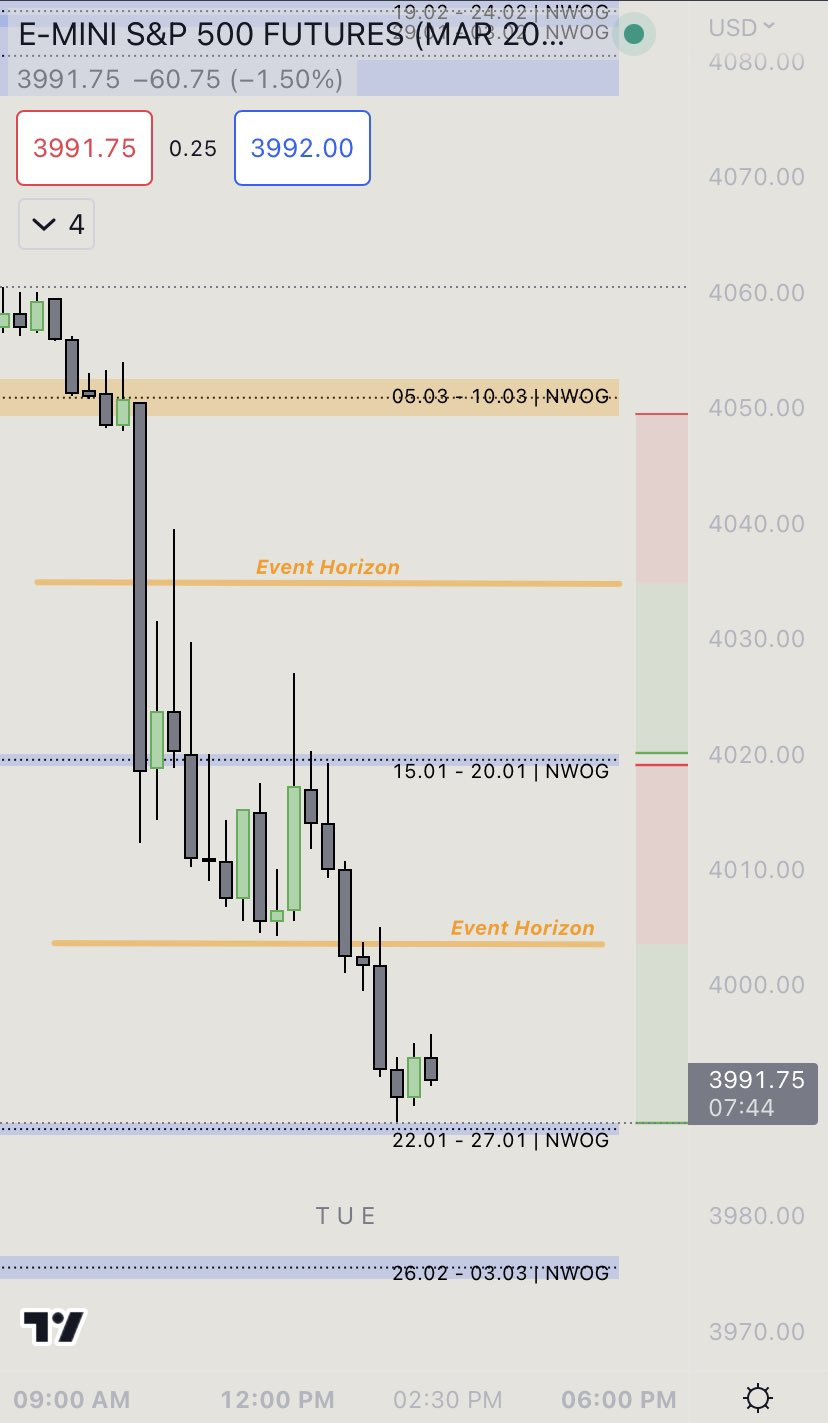
Example 3
ES 15m
[top]
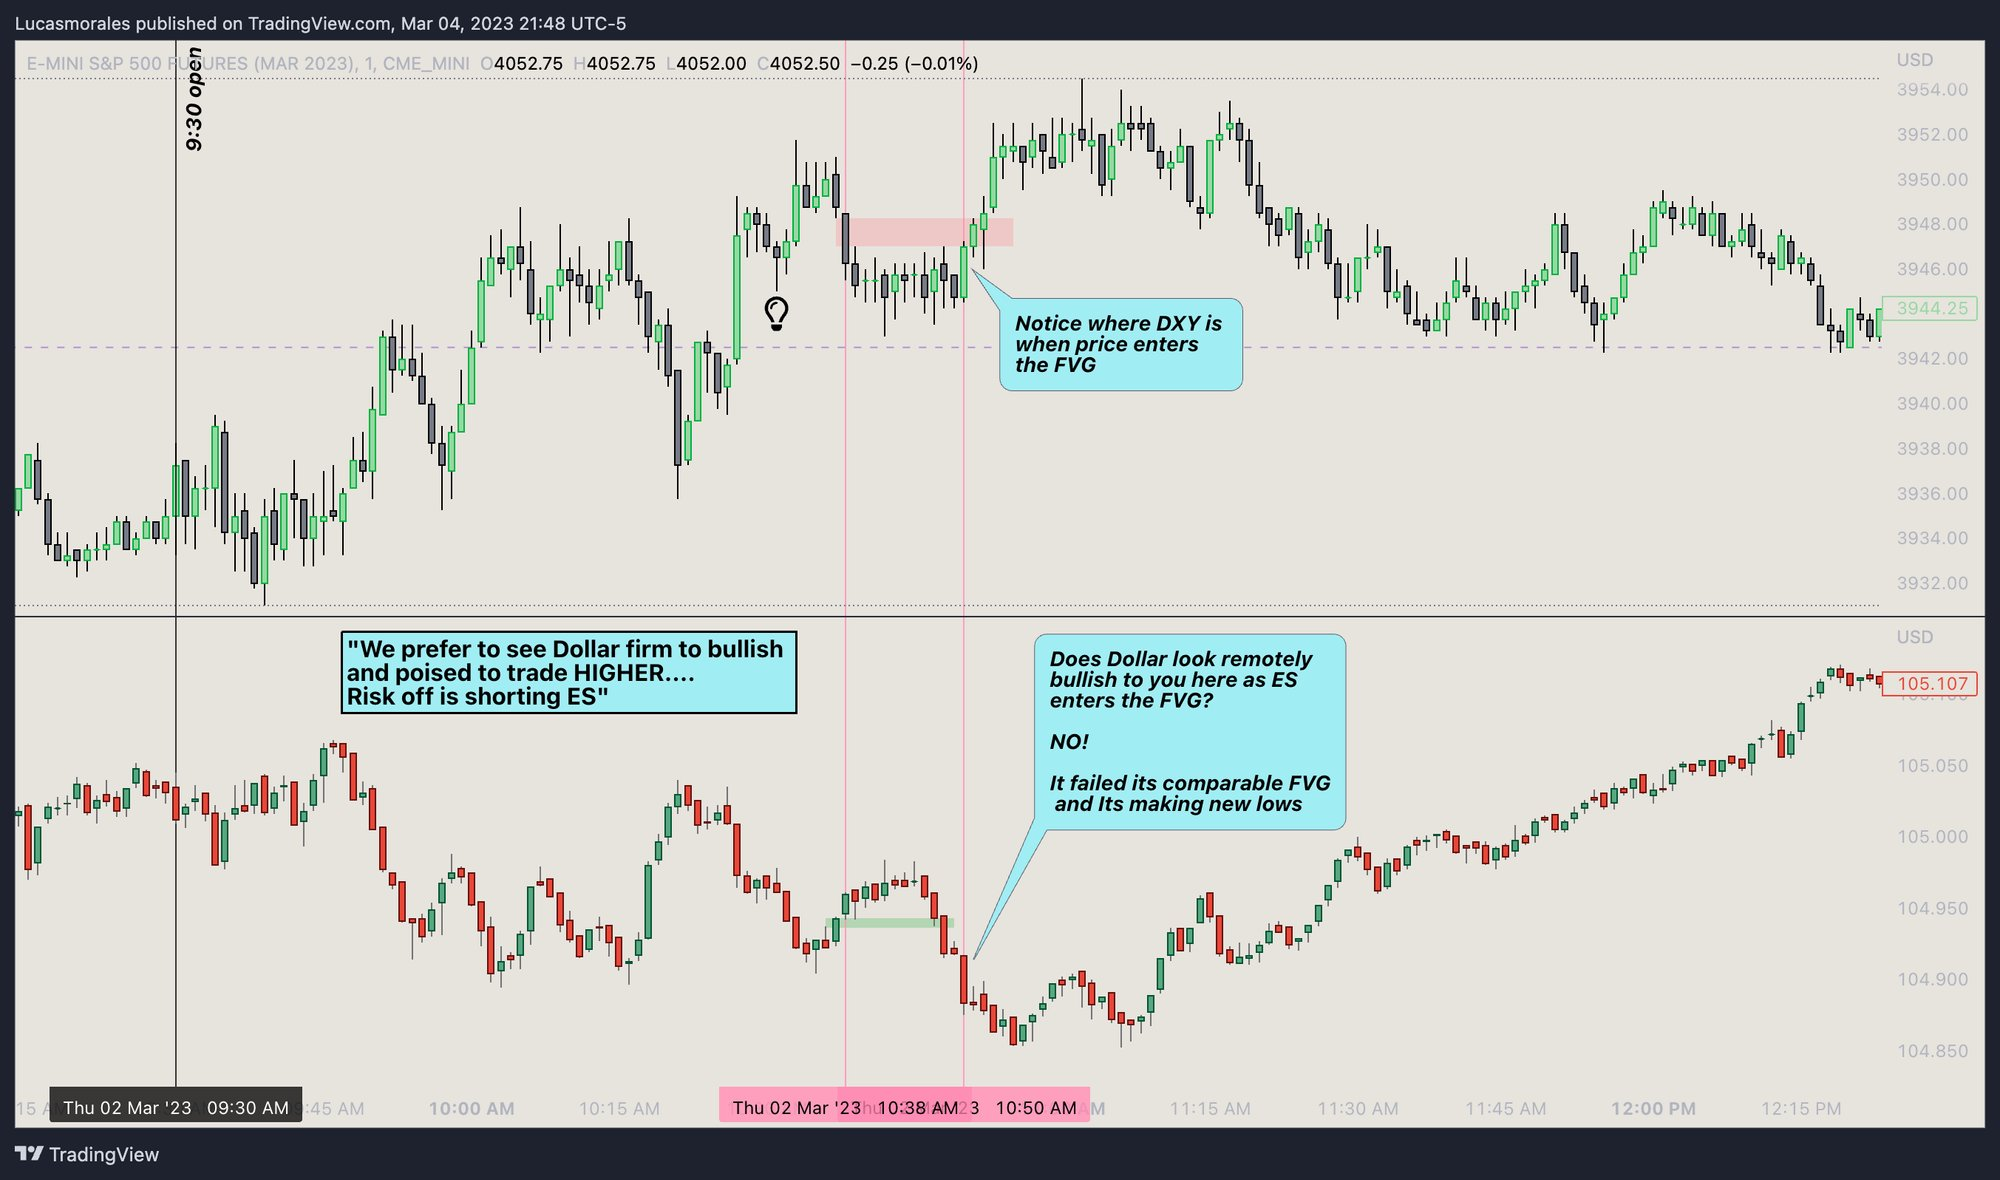
How to avoid taking a low probability FVG
How to AVOID taking low probability FVGs using DXY
[top]
How far can you trust price to go above BSL or SSL for a Turtle Soup?
How far can you trust price to go above BSL or SSL for a Turtle Soup?
NWOG
NDOG
Opening Range Gap
These are 3 specific tools you can use to answer this question
[top]
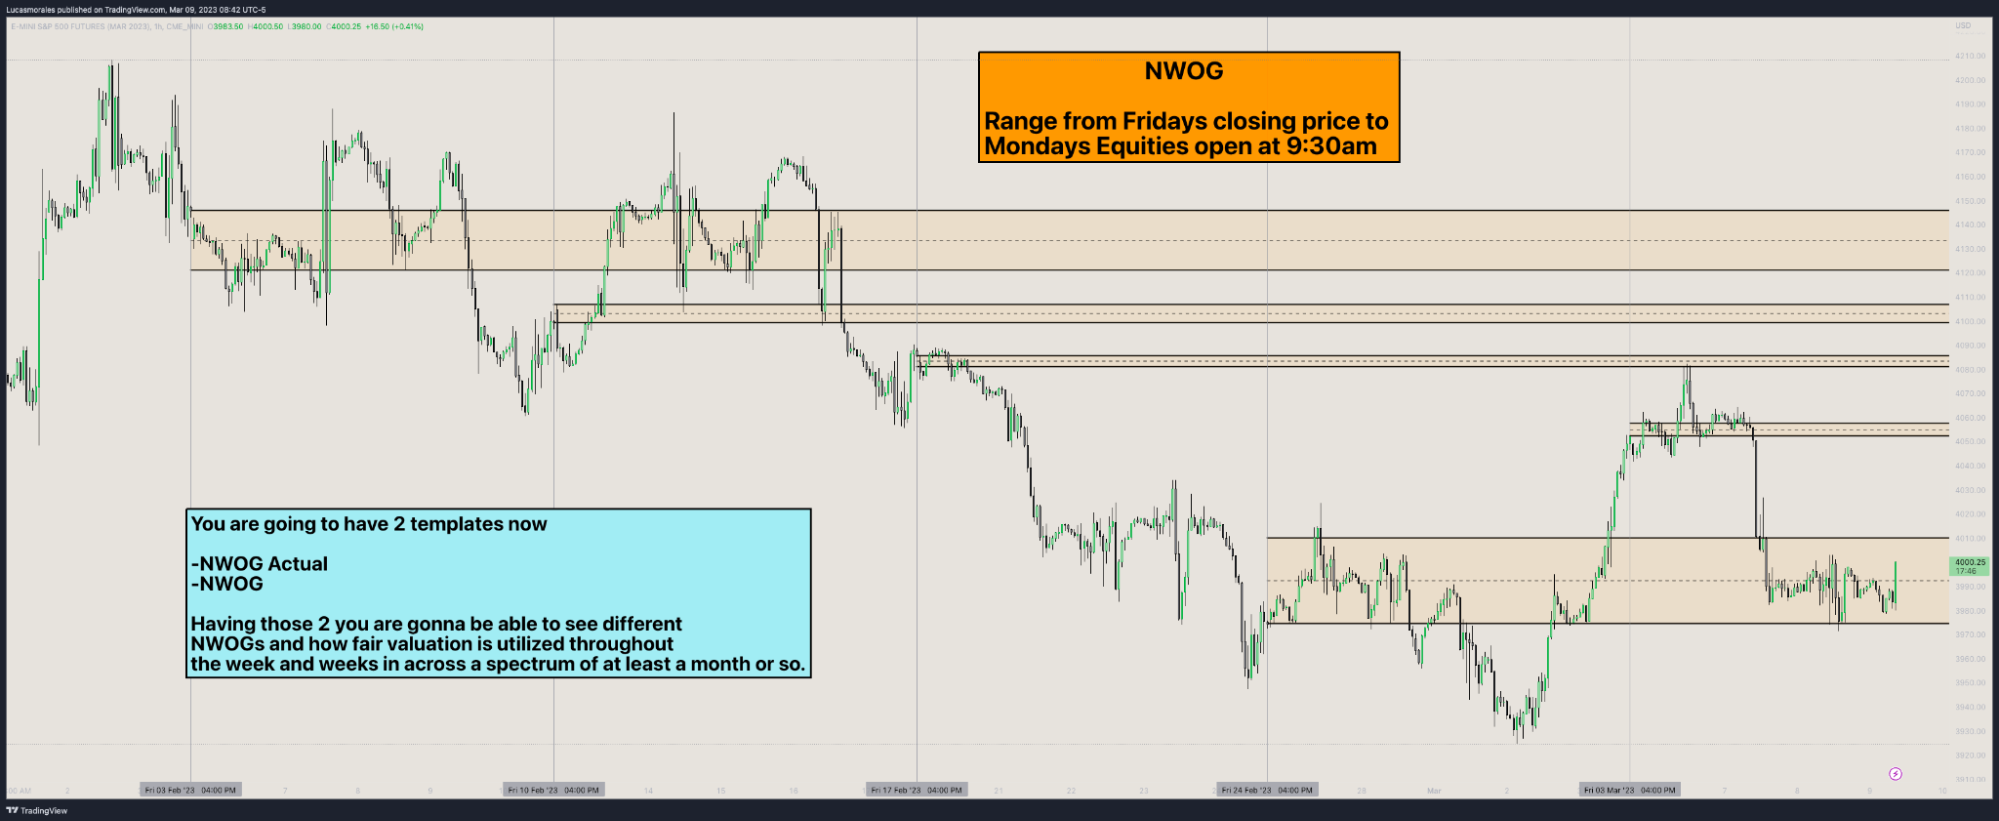
NWOG Actual and NWOG
NWOG Actual = Fridays close to Sundays Open
NWOG = Fridays close to Mondays Equities Open at 9:30am
(On a personal note I don't use NWOG from close to Monday 9:30 open. All I use is NWOG Actual and I think that's more than enough)
[top]
Macros
A macro is a window of time where the algorithm will seek untapped liquidity or an imbalance. You can split your day up into windows of time and only trade these macros!
You can enter prior to the macro beginning.
The run will originate inside the macro time but does not have to complete it. It can still deliver after macro close
The NY session Macros (All NY eastern time):
9:50-10:10am (MY FAVORITE)
10:50-11:10 am
11:50-12:10 pm (l never trade this one...)
1:30pm Judas
3:15-3:45 pm "Sweet Spot"
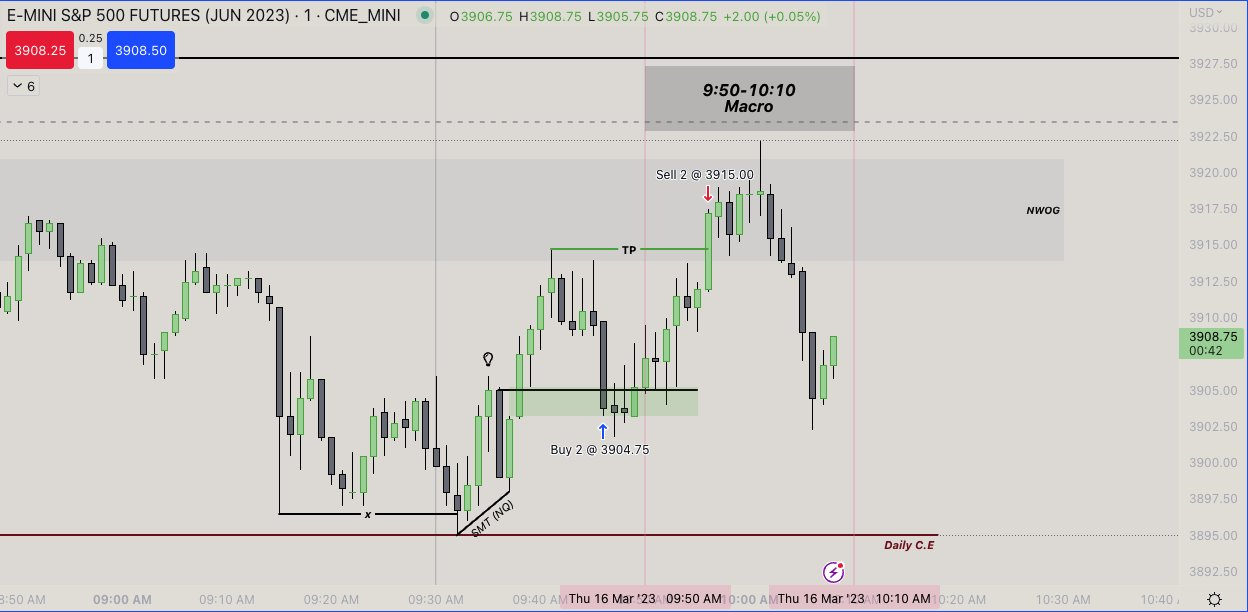
As a bonus here are some example of my favorite macro 9:50-10:10:
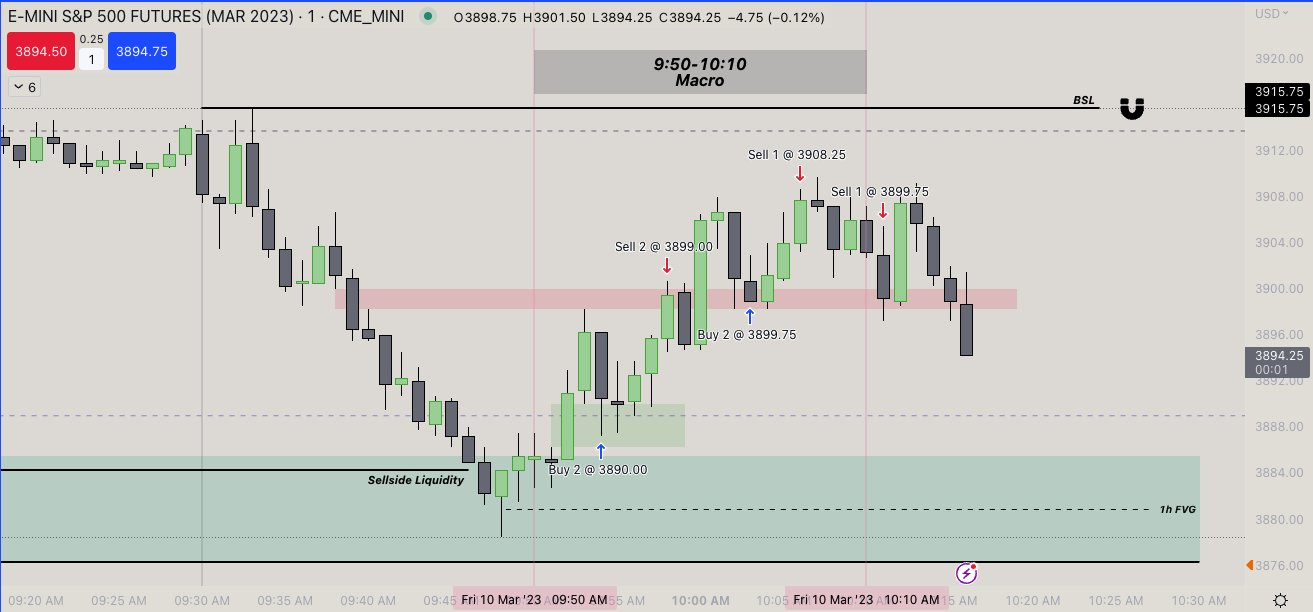
Example 1 (ES 1 min)
SSL swept right at open into Daily C.E level
MSS+Displacement created FVG and +OB
SMT with NQ
Long entry in FVG
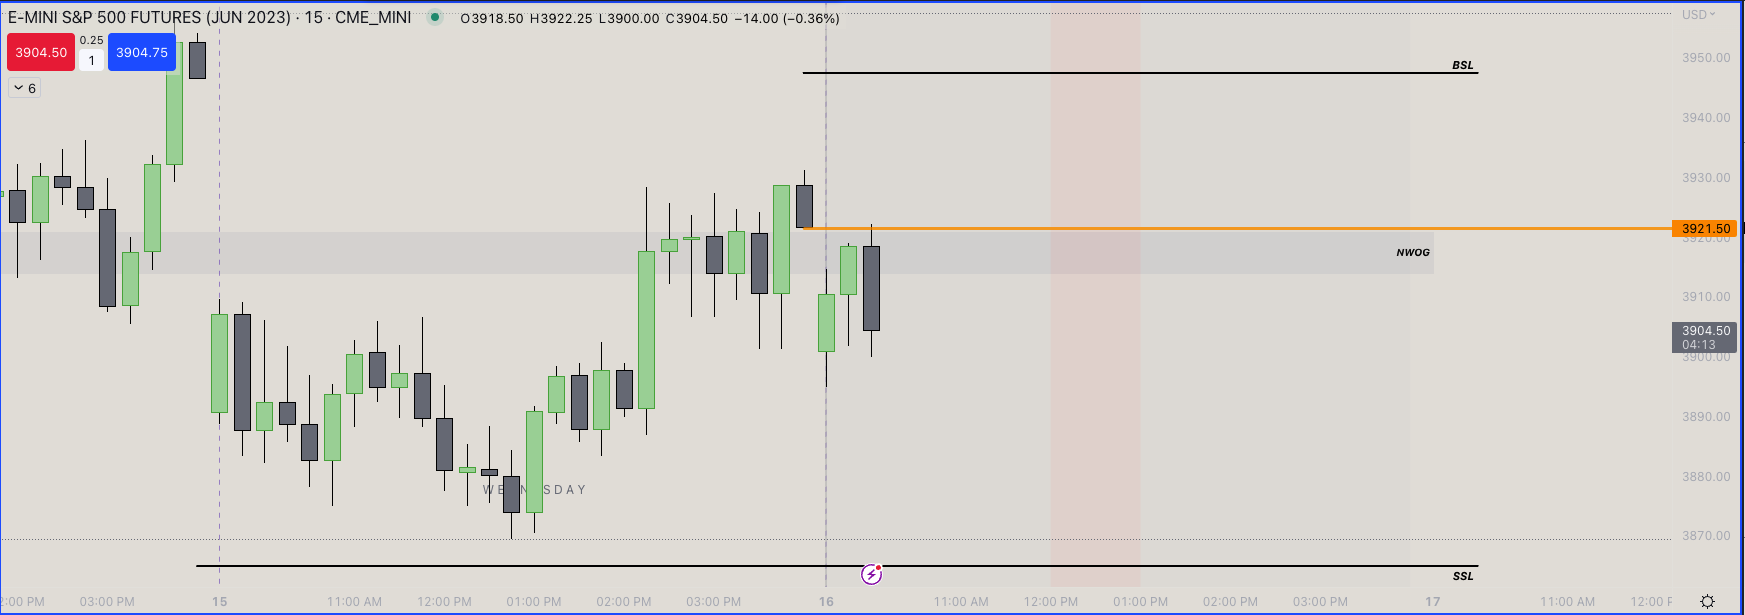
Target most recent high break/ NWOG
I would also like to add that The RTH gap gave me a soft bullish bias this morning which gave me confidence in tak)ing this long. As you can see we filled it PERFECTLY (ES 15 min
Example 2 (ES 1 min)
A couple ES NFP Friday Scalps
1st:
LOD sweep + 1H FVG C.E
Strong Displacement creating FVG
1m bearish FVG clear DOL
2nd:
Entry off inversion level and +OB
Scale at new short term high
Wanted 3916 but stopped B.E on runners
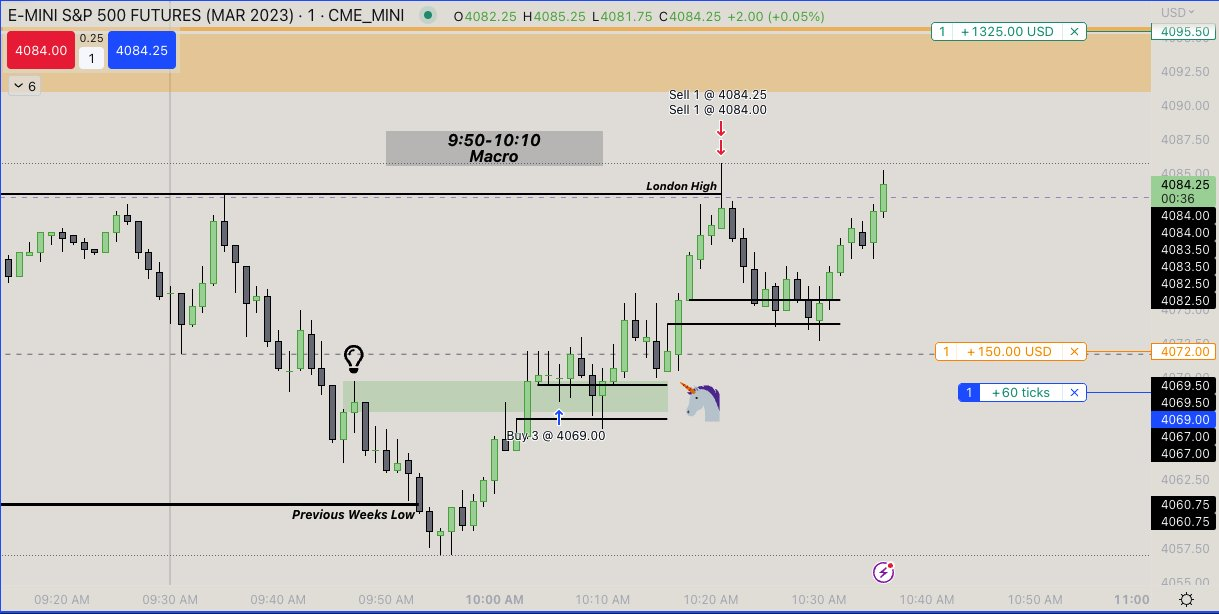
Example 3 (ES 1 min)
Market left REHs at the London High
Previous Week's low Sell side swept and had a MSS+Displacement (2022 model)
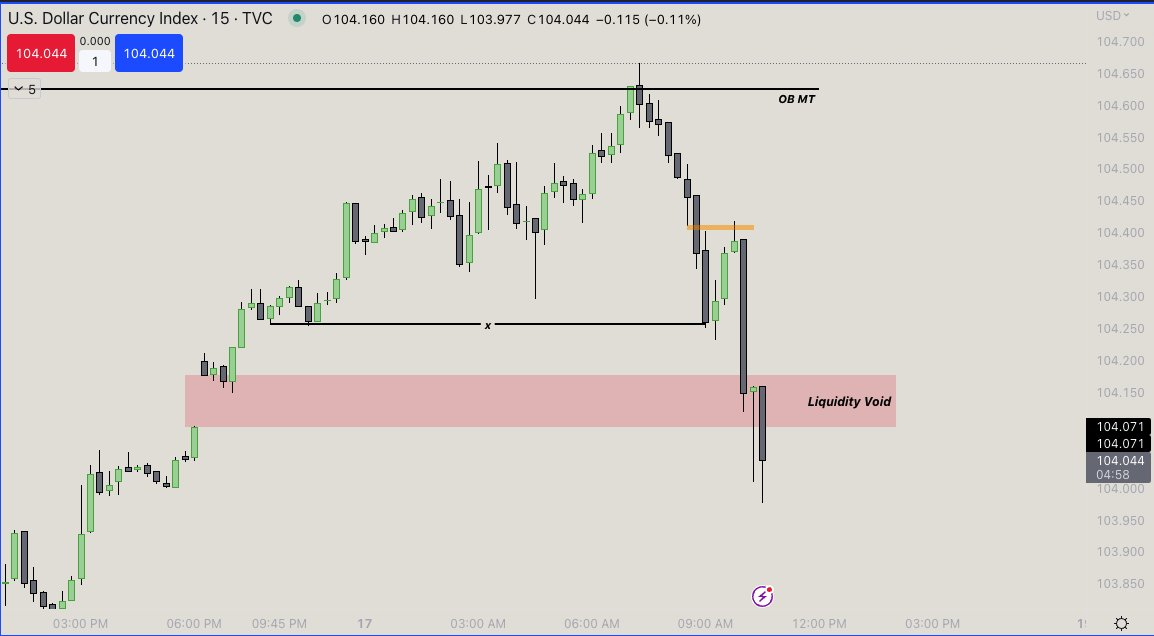
DXY had a liquidity void to fill below meaning ES
Long entry in the Unicorn
DXY 15 min
[top]
10-11am Silver Bullet
[top]
MSS after 1pm
[top]
How to use NWOG inside of old areas of orderflow
[top]
Immediate Rebalance
[top]
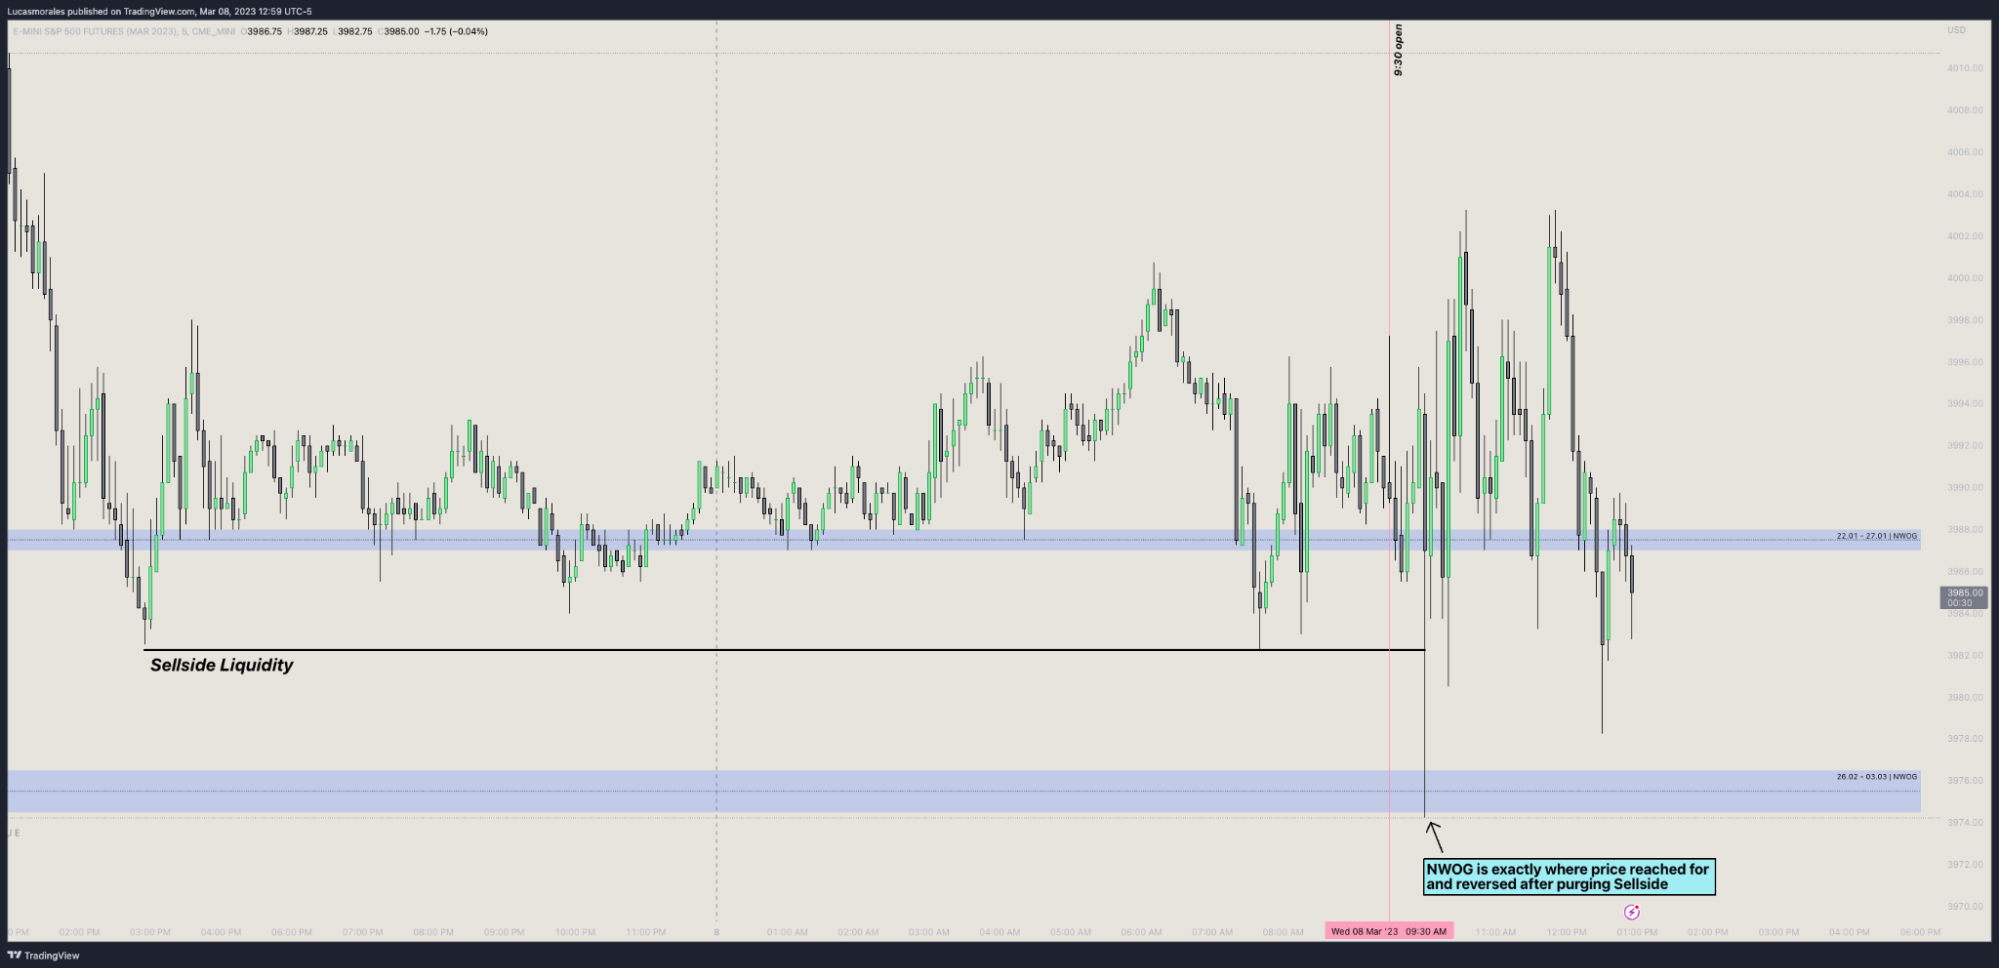
Using NWOG to analyze market conditions
[top]
Inversion FVG example
[top]
How to approach the lunch hour when bias/target is clear
[top]
Seek and Destroy cheat sheet
[top]
Partials at wicks/long tails
[top]
Understanding Balanced Price Ranges(BPRs)
[top]
More Silver Bullet gems
[top]
ICT Glossary of terms
[top]